PID temperature excel simulator

rlawson

Member
Join Date
Feb 2006
Location
Hickory, NC
Posts
31
I've browsed, searched and read almost every post dedicated to PID on this forum. It is amazing just how much knowledge can be gained by reading other users posts. I would like to mention Peter and Ron specifically for their contributions to this forum helping to educate the rest of us. With the information that I have learned here I have implemented quite a few projects sucessfully using PID for motion and position control.

I have downloaded a few of the PID simulator excel files and have enjoying toying with them. But one thing that I am looking for is an excel PID simulator for temperature control. I am getting ready to do an upgrade of a batch baking oven using a Directlogic D260 PLC. I haven't really modeled the existing system yet, but I would like to play around with various settings using a simulator. I have used this PLC many times utilizing PID for dancer control on various wire drawbenches and winder takeups. If Ron or Peter already has this spreadsheet I would very much like to see it.
 
Programming in Excel is very awkard

I will see what I have got in Scilab. I prefer to use Scilab. Scilab is free at
http://www.scilab.org/
Scilab is a free version of Matlab. They are very similar. I know I have lots of SOPDT temperature control Mathcad work sheets.

I have written a real time SOPDT simulator using our motion controller's programming language ( ST ). It is gross overkill but it works well and has excellent graphs/trends. It closes the loop once a second. The simulation and PID control takes only 64 micro seconds. Needless to say we could close many 1000s of PIDs at a time if we had the much I/O.

I have SOPDT temperature control analyzed pretty thoroughly. I have the tuning equations given the plants gain, two time constants, and dead time. I know I have posted my SOPDT gain finder ( auto tuning ) software on this forum a couple of years ago.

Does AD have trending capabilities? It has been a long time since I have played with our AD250.
 
Peter, I am having a little trouble downloading scilab because our plant bandwidth download restrictions. Do you have any of the excel based temperature simulators handy? I'd sure appreciate it. I will download scilab tonight at home and try it.

Thanks for your help
 
I found a post about SMC that you were in, and you posted a SMC for Automation Direct D250. I tried the download link and it apparently is an old link that says the page has been moved. Do you still have that file?
 
My Excel Files are here

http://www.deltamotion.com/peter/xls/
None of these are SOPDT temperature systems. The T0P4 file would be the closest.

I don't know if I have the old AD250 SMC file. That was a long time and many computers ago.

If found that SMC works well if there is no dead time. Otherwise it needs something like a Smith Predictor. I am looking for the Scilab files now.
 
The system that I will be mimicking is a batch baking oven, that I have not did a process model yet. I will be stripping out the existing control system and implementing my own PLC based system. It currently utilizes a honeywell loop controller that does a decent job. So I know that I will have to have new PID settings in the PLC since it seems no 2 PID algorithms are the same. But I would like a simulator that I can play around with to see how various settings affect the control output. I do know that the oven has a dead time of a few minutes, I'll get an accurate reading once I do some trend charting. I do understand PID and what each parameter brings to the table, but I would like a tool to be able to show the technicians here in the plant how the various settings affect the output. PID is something that I have tried explaining, but seeing it in action on a simulator will help to demystify it.
 
TSo I know that I will have to have new PID settings in the PLC since it seems no 2 PID algorithms are the same.
Actually, that isn't true anymore. Many companies use the ISA temperature PID where there is a plant gain and integrator and derivative time constant.
If you can find that out you will be miles ahead.

But I would like a simulator that I can play around with to see how various settings affect the control output. I do know that the oven has a dead time of a few minutes, I'll get an accurate reading once I do some trend charting.
Ovens are a little different. The mass that is being heated depends on the rate at which product enters and leaves the oven. A feed forward would help in these situations.

I do understand PID and what each parameter brings to the table, but I would like a tool to be able to show the technicians here in the plant how the various settings affect the output. PID is something that I have tried explaining, but seeing it in action on a simulator will help to demystify it.
Did you download Scilab?
 
Greetings rlawson ...

I do know that the oven has a dead time of a few minutes, I'll get an accurate reading once I do some trend charting.

I recommend that you do an "open loop" characteristic test like the one shown in the following link - and then post the results here ...

http://www.plctalk.net/qanda/showthread.php?p=65377&postcount=21

I'd be willing to bet that you would have the simulator you desire in very short order ...

if you're not sure EXACTLY how to set up the test, please post again and ask ... key points: the system MUST go from a "steady state" condition TO another "steady state" condition - with only the "manual setting" making a known "step change" ...

in other words, start with some small amount of "drive" and wait PATIENTLY for a "flat line" condition ... then increase the amount of "drive" - and wait PATIENTLY for another "flat line" condition ...

besides the two obvious traces (PV and CV), you MUST show the "temperature scale" - and also the "time scale" ...

once you've completed the test, you could also do a Right-Click on the trend and create a "Snapshot" of the data and post the resulting DBF file too ... my distinguished colleague Peter likes to work directly from the numbers ... I'm not that smart - so I prefer a graph ...

it would also be helpful if you could change the background color of the trend to WHITE instead of the default BLACK ... that will make it much easier for my tired old eyes to work with ...
 
Last edited:
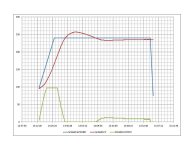
I did a little trend chart a while back, when I did some experimenting. It was on a ramp though. I will get more information. Temperature scale on left, time on bottom. This is an oven will be doing ramp/soaks as well as regular setpoint (no ramp) heating. What can you tell me about what you observe so far? Thank you guys for participating.

chart.jpg
 
is this for an empty oven?

What can you tell me about what you observe so far?
It looks like a typical PID. The integrator time constant looks to be a little long. The dead time does look bad. The time from when the control output drops at about 13:30 to the time the temperature rate starts to decrease is about 10 minutes. I didn't look that closely. It is easy to see the dead time is greater than a minute and significant compared to the plant time constants.

One of the things I look for is the change in temperature with the change in control output. It is best if you have two periods shown where the control output is allowed to be relatively constant at two different temperatures. If ambient is about 80 degrees you can see it take about 20% control output to maintain an increase of 150 degrees ( 230-80 ) than is about 7.5 degrees per degree above ambient. It is hard to estimate a dead time or time constant because the graph didn't show a steady state time at the beginning.
 
Actually, that isn't true anymore. Many companies use the ISA temperature PID where there is a plant gain and integrator and derivative time constant.
If you can find that out you will be miles ahead.

Here's a chapter in the PLC manual that deals with their implementation of the PID loop. Pages 6-15 would be the relevant material, I think. Edit: I should note that this information pertains to the PID he will be moving to, not the one he has now.

http://www.automationdirect.com/static/manuals/d2user/ch8.pdf

Also, keep in mind that a batch furnace wouldn't really have a feed forward in the traditional sense. You would be thinking about belt-type furnace. A batch furnace (to me anyway) would have a load of X pounds placed in it and left there for the entire processing time, then removed. In my case X can range from 10 to 1000 pounds or more in some of our equipment.


Brian
 

Similar Topics

I have S7 1512C controler for controlling 48 PID temperature loop, the output is PWM. Please I need the best, most efficient way to write the...
Replies
13
Views
600
I have an old Chinese Temperature PID controller XMT 8038c2kp that am able to send and receive requests via Modbus poll test center in this format...
Replies
0
Views
441
I have PID temperature control which will connect to Beckhoff EL4004(0v-10v). How I can program it to let EL4004 to control the temperature?
Replies
7
Views
2,629
Hi everyone, Im planning to replace existing temperature controllers with a PLC. The setup will be aprox 8 thermocuples, and the outputs are 8...
Replies
10
Views
5,374
I'm doing PID temperature controller using PLC. I'm doing a cascaded P, and PI controller of both temperature set points. My question is how...
Replies
6
Views
1,732
Back
Top Bottom