Resonance frequency in electrical drive system

Plc_User

Member
Join Date
Dec 2005
Location
Belgium
Posts
317
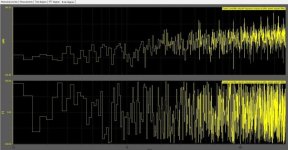
I did a measurement of 'speed setpoint response' in a Siemens S120 drive. This results in a Bode diagram that shows the amplitude and phase shift. Normally I should expect two poles : a locked rotor frequency and a resonance frequency. But in my case I see phase shift all over the frequency domain.
I has to be said that the system is sensitive to vibration, but I did not expect such a bode diagram.
Could this diagram be realistic for a oscillation sensitive system or could there be something wrong with my measurement (although I could not think what)?

sp response.jpg
 
I would start with a 400Hz low-pass filter if you don't have something in there already. Then you can do another trace and see if you have more sensible results.
 
The results look meaningless. It is just noise.

I did a measurement of 'speed setpoint response' in a Siemens S120 drive.
How is this test done? That makes a lot of difference


This results in a Bode diagram that shows the amplitude and phase shift.
Either this system has an extremely very high bandwidth or the test as conducted wrong.


Normally I should expect two poles : a locked rotor frequency and a resonance frequency. But in my case I see phase shift all over the frequency domain.
The rotor and load inertia pole is one pole but a resonance frequency requires 2 comples poles. It is the complex poles that give tradition motor control troubles.

I has to be said that the system is sensitive to vibration, but I did not expect such a bode diagram.
Is the machine rigid? Usually motors have problems turning a large mass on long shaft. The shaft flexes and that adds the two complex poles.

Could this diagram be realistic for a oscillation sensitive system or could there be something wrong with my measurement (although I could not think what)?
[/quote]
It doesn't look realistic. I see no resonant peak caused by the complex poles and I see no amplitude drop after the frequency reaches the corner frequency due to the motor and load inertia.

What is the system?
How does the system excited? The excitation signal is key to getting good data.
How many sample points are taken?
Can the data be saved in a CSV file so I can look at it?
 
I would expect the Bode plot to look something like this:

http://www.plctalk.net/qanda/attachment.php?attachmentid=33699&stc=1&d=1410286934

Page 1 shows the data I used. Each row is the time in milliseconds, target position, actual position, target velocity, actual velocity, control output and status bits. I am using 1 seconds' worth of data or 1000 readings. Not just a few like most auto tuners.

There are a bunch of calculations between the first page and the second page that I am reluctant to show.

Page 2-3 shows that the model I calculated is pretty good. My estimated position, velocity match the actual data closely. Notice that the velocity calculated from the feed back shows the effects of quantizing due to the feedback resolution and that my estimated velocity is much smoother but isn't filtered or delayed like most controllers would do. I display the actual acceleration. Notice that it too is smooth. There is no way the acceleration can be calculated directly from the feed back device. The green line is the control output used to excite the actuator. Most system identifications use square waves because it is easier but try a square wave when trying to tune a hydraulic actuator with a 90 ton roll of steel on it and you will be asked to leave quickly.

page 4. I would expect the Bode plot to look something like this.
Since I am plotting the response for position the Bode plot starts out with a 90 degrees phase lag. This happens because the velocity is integrated to get position. This adds 90 degrees of phase shift. A velocity Bode plot should start at 0 degrees of phase shift and then drop as the frequency gets higher. Notice this is a resonance peak at about 20Hz and the phase lag increases rapidly. This is what a resonance peak looks like and I see nothing like it in Plc_User's data.

In Plc_User's graphs there is no way the data can change that much from one frequency to another.
 
Last edited:

Similar Topics

Hello all, we're using a Siemens G120 VFD to control a 3hp inverter rated motor for a small project. To make sure everything worked, we bought...
Replies
17
Views
4,077
Hello guys, I am new to this forum and have some problems with my PowerFlex755 EENET frequency inverter. I want to do a point to point...
Replies
9
Views
378
Hey all, I am currently working on a depalletizer for a customer and we are doing a hoist upgrade. This is a SLC500 processor and the drives are...
Replies
6
Views
288
Communication between devices will stop working for a certain period of time. I caught the error message using WireShark. I cannot identify the...
Replies
0
Views
100
I have am trying to determine if I can use a 1756-IB16I (or some dc input equivalent) to handle a 24vdc input pulse frequency of 80 pulses per...
Replies
15
Views
911
Back
Top Bottom