RS Logix 5000 Trending

Negatronic

Member
Join Date
Jun 2017
Location
Kentucky
Posts
9
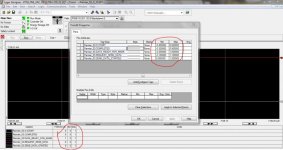
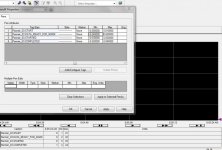
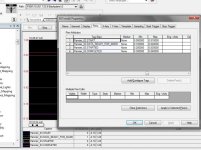
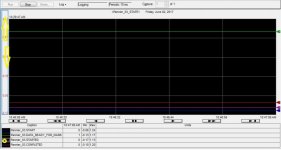
Hello guys. I am having a hard time with trending in RS Logix 5000. Specifically, with Y axis settings and min max value settings. I am trying to trend 4-6 Boolean bits with slightly offset min and max. My Y axis is on Preset [min / max from pens tab]. Even with offset min/max values in the pens tab, and axis set on preset, my pens are always either out of scale (not on the graph completely or at all) or all on top of each other. I have noticed that my min/max settings in the pens tab, often does not match what is in the legend [images attached]. Has anyone had similar problems? I apologize in advanced if this post is redundant. I tried searching the forum, but kept getting an internal server error. Thank you! 🤞🏻

Trend A.jpg Trend B.jpg
 
no time to write - but see if there is a setting for "isolated graphing" or something along those lines ... (this is from memory - so ignore me if it doesn't make sense) ... gotta go ...
 
Isolated graphing is not enabled. I want my lines to be in the same space, but just have different slightly different high low positions. Thank you.
 
but just have different slightly different high low positions

then in logic - add 1 or 2 or 3, etc. to whatever "original" 1 or 0 values coming from the tags - place the new values in "trend-me" tags - and graph those new tag values ... that should give you what you're asking for ...
 
Is the trend inadvertently zoomed? Try right-clicking on the chart to see if "Undo Zoom/Pan" is not grayed out. Otherwise it sounds like a mystery with the information provided (i.e., y-axis radio button is on Preset).
 
You're on the right track using different mins and maxes for each bool. BUT min must be <0 and max must be >1 for each of them to get 0 and 1 to appear in the trend.
 
You're on the right track using different mins and maxes for each bool. BUT min must be <0 and max must be >1 for each of them to get 0 and 1 to appear in the trend.

Yes, and in addition, make sure the display scale (also on the Y-axis tab) has at least one decimal place when using min and max values like these.
 
Progress?

Thank you all. I am still having the problem, but I found a work around. In my Pens tab all of my pens have slightly differing min max. I verified I am not zoomed in. I changed the scale to display 2 decimal places. Here is where I'm at.
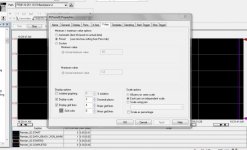
When I select "Preset (use pens tab)" on the Y axis tab, my high and low values are always just below and just above the field of view. I can move individual pens up and down but never see the entire cycle.
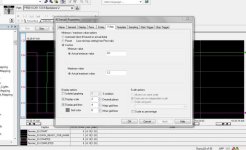
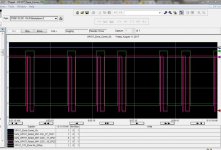
When I select "Custom" on the Y axis tab, I can see the entire cycle if my field of view is wider than my 'min/max' settings, but all of my pens are directly on top of each other, regardless of my min/max setting on the pens tab. Also note that my min/max on my pens tab does not match legend.
Here is the work around that I found. I set the 'min/max in "Pens" tab to 0-.2 for MIN; and .8-1 for MAX. Then go to my Y axis tab and set to "Custom" (-.1 to 1.2) making sure that it is larger than my Pens Tab Min/Max. Now when I go to trend, I can see everything, but they are on top of each other still. :cry:
BUT, I can select individual Pens on the Legend, and then move them UP/DOWN in relation to other pens by dragging the Scale bar up or down (Trend F.jpg). This gives me a zoom cursor indefinitely, and when I "Undo Zoom/Pan" all my pens go back to being on top of each other again. At least I can see some useful data for a time. I know there has to be a better way to do this. Any related info would be appreciated.

Trend C.jpg Trend D.jpg Trend E.jpg Trend F.jpg
 
just for kicks what happens when you set preset and pens min all below zero ie (-1,-2,-3,-4) and maxs all above 1 (2,3,4,5)

or (-0.1,-0.2,-0.3,-0.4)(1.1,1.2,1.3,1.4)
 
Last edited:
I'm not sure the trend is made to do what you are trying to do. If I was going to monitor a bunch of bools on the same graph, I would multiply them by an offset before graphing them.

pen1 = bool1 x5
pen2 = bool2 x10

Then you can leave the pen min/max settings at default (0-100) and only worry about the overall scale.
 
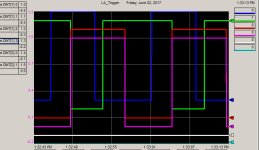
When using a shared Y-axis with multiple pens, be aware that the values shown on the axis legend correspond to the selected trend. By default, this is the first pen on the list. If you click on a different data item, the y-axis scale value will change to reflect that new choice. In the example below, I clicked on the fourth item (purple), which changed the scale to that pen (-0.2 to 1.3).

As long as you're consistent with the same range for each value, the pulses should overlap as shown in this example.

One other thing, when configuring the pens you want the Type to be analog even though it is bit data when using this approach.

Trend.jpg
 
So I hit a breakthrough on this issue a couple of weeks ago, and I figured I should share it with you guys. I was having trouble getting multiple tags to appear on a trend without the MIN/MAX getting jacked up.

All my problems went away when I saved, closed, and reopened the trend.
The Y axis can be set to preset (I like -.2 to +1.2 for bools). The Lines will all be stacked on top of each other, but then all I have to do is select one tag on the legend, then drag up/down on the Y-Axis scale to offset each line.

Thanks everybody.

TREDD.jpg
 

Similar Topics

This isn't a question but more like a FYI. I was using a bunch of trends (around 15) each fully loaded at 8 pens each. Over the course of a few...
Replies
0
Views
911
I am familiar with trending data in rslogix, but can I export a trend table to excel manually or automatically? What are the steps if this can be...
Replies
2
Views
7,828
I have a application where i'm looking at using some data logging in a AB L43 processor with a PV+ 700. Instead of using force vs time i want to...
Replies
2
Views
3,123
Hi folks, in the alarm manager of Rslogix 5000, the tag-based alarm has been created. But when I tried to change the condition, it was found the...
Replies
2
Views
151
Back
Top Bottom