ControlLogix SLC Typed Read/Write SLC 505

ruairicussen

Member
Join Date
Nov 2011
Location
port angeles
Posts
17
Hello,

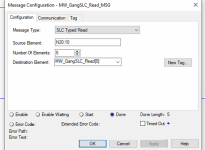
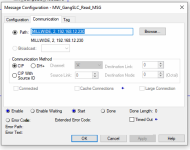
I inherited a control system one of my predecessors thought it was a good idea to put logic for cant optimization and Kinetix motion control (infeed table positioning pins)in new ControlLogix PAC, and retain existing SLC 505 for the bulk of machine functions. The Status of machine input devices, and actual control of IO to pull in motor starters, fire valves, etc.. are all in the SLC. New operator console is to FlexIO ControlLogix. Not something i would have ever done, and maybe the only answer is to basically finish the project by bringing all IO into CLX and deleting SLC. I do not have a lot of experience with MSG instructions, maybe there is a way to do better with the above "System Design".


Issues are extreme delay in response to operator pressing buttons on new operator console (CLX I/O) for the machine functions (SLC 505 IO) to respond.


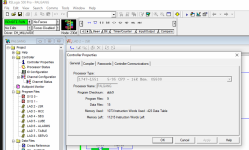
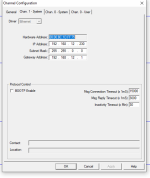
Physical Network Layer: a while back i replaced all of the physical plantwide control network with new Fiber/CAT6 installed by reputable contractor and test reports of all cables and fiber. I use these guys for all network projects on the OT and IT side. The switches in this star topology network are 1783-HMS16T4C AB Stratix 5400. Connections between hubs in the network topology are 10Gb fiber. No copper runs are longer than 150', the CLX and SLC involved in this system are both CAT6 runs to the same Stratix, both within 50' of the Stratix. Both cables tested 1Gb. The SLC appears to be a 10 Half Duplex device, based on that is the connection the Stratix web interface shows (i am not currently on site with these devices, but in the Logix 500 controller properties i see the ethernet port but no config other than BOOTP/Static, IP, Subnet Mask, Gateway). It also shows flashing orange "Faulty Link" intermittently in the Stratix web interface, but as far as i can tell from observing these Stratix web pages, all SLC, PLC5, and Red Lion touchscreens show the same, even though those cables test the same as all the 10/100 Full Duplex devices (primarily 1756-EN2TR and Softing 1756-EAtm in-chassis SQL appliances). I have high confidence in the physical layer.


I do not have high confidence in my own expertise with MSG instructions. I have used them a bit, but mostly was using other vendors hardware until AB got to CLX hardware, so that is mostly what i have worked with. The message trigger logic in the program seemed like it might be a little weird, so i did rewrite everything and shorten the .UnconnectedMessageTimeout for the MSG instructions. None of this made any differnece to the underlying issues, though i was able to mitigate some of the symptoms. When i started there were about 50 times per hour where MSGs would error and comms would stop for > 5 seconds. Now it is about 2 times per hour for about 2 seconds. I think better sequential calling of MSGs accounts for the less errors and the shorter timeouts help with duration.


Hoping for the usual genius suggestions here. Attachment sizes are too small to attach programs, so i will attach some screenshots.


Attachments:

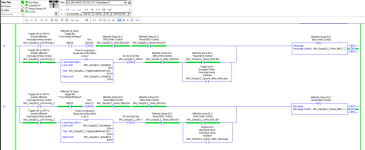
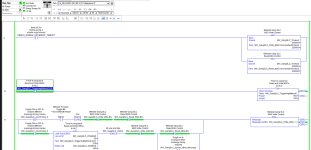
Msg Control Logic 1

and
Msg Control Logic 2

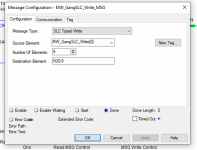
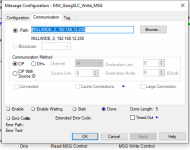
These are all the rungs controlling the only 2 MSG instruction in the CLX.


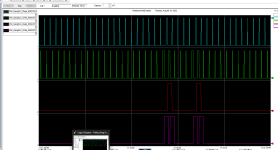
Msg30SecondTrend

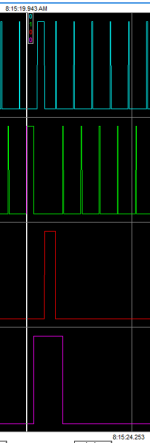
This is a 30 second trend, top 2 trendlines are Read MSG and Write MSG .EN bits, bottom 2 are Read MSG and Write MSG .ER bits. I had to wait a few minutes to get the error, but when it happens it is always shaped like this. Write MSG errors, then Read MSG errors, then write MSG errors again, then things go back to normal. With different overall Message control timer preset, and Read and Write LIM settings, i can make different shaped errors. but always there are MSGs erroring every few minutes.


Thank You in advance for any pointers on this.

Ruairi


MSG control logic 1.PNG MSG control logic 2.PNG Msg30SecondTrend.PNG
 
So, you have a ControlLogix with Flex IO and motion control as well as a SLC 5/05 that's getting information via MSG? If there's nothing special in the SLC rack (like serial comms, BASIC module, etc.), I would consider a 1747-AENTR module to take the place of the 5/05 CPU and turn the rack into an IO rack controlled by the ControlLogix. They're pretty pricy, though, and may be hard to find. It may be more cost effective in the long run to gut the SLC system altogether and replace it with an IO rack, like another FLEX IO or a Point IO. Or even a 1769 Compact IO if that's all you can get.


My personal preference, based on seeing some...not well done partial migrations like that in the past, is to gut the whole system and put an IO rack in there.
 
Joseph,

I 100% agree with everything you say there. With our major projects already ongoing this year, I am going to have to wait until next year to do this small project. Just hoping for some pointers on anything i can do in the meantime programmatically to make this work better in the meantime.


Thank You
 
Change the maximum tag update rate in the display settings of every display in the PV project.

It defaults to 1 second. It can be set as low as .05 seconds.
 
Thank you for the detailed information about the system architecture and the challenges of this phased-but-incomplete migration.

My guess is that your predecessor did this before the 1747-AENTR was available to control that SLC-era I/O, or they figured that leaving the logic where it was tested and stable was the safest decision.

Can you put some numbers on the "extreme delay", in seconds or milliseconds ?

I think that the "Faulty Link" issue deserves further examination. SLC-5/05 controllers prior to Series C had a 10 Mb half-duplex port only, even ones that could be firmware upgraded to an OS that was compatible with Series C. Only the units that are physically labeled "10/100" on the front by the Ethernet port support 100 Mb Fast Ethernet and auto-negotiation. I see that yours is identified as OS500: it's probably an older Series A built 20+ years ago.

If you do have a 10 Mb/Half Duplex controller, the swtich port connected to it should be hard-set for 10 Mb/Half Duplex, rather than left in auto-Negotiate, to avoid the occasional link reset and attempts to negotiate a higher speed and duplex by the switch.

That is ordinary behavior of a link where one side is 10/Half and the other side is Auto-Negotiate. The Auto-Negotiate side doesn't just accept that 10/Half is the best the link can do forever: it periodically drops the link and tries to negotiate again.

I'm going to take a careful look at those screenshots and see if I can give some advice next.
 
Let's see if I can write out my understanding of the two timing methods.

Timing Method 1 is offscreen because we don't see the logic for the Bit[10] tag that alternates triggering a Read and a Write. My guess is that it literally alternates: as soon as /DN or /ER occurs for one, it changes state to trigger the other.

That typically works fine if you don't mind using up as much bandwidth as both controllers will give you, and if you don't mind pausing until the application timeout expires every time there's a failure.

Timing Method 2 intends to exchange data every 750 milliseconds between the ControlLogix and the SLC-5/05. When the repeating timer hits 50 ms it should execute the Write instruction, and when the timer hits 500 ms it should execute the Read instruction.

In theory if those complete in less than 450 ms (for the Write) or 300 ms (for the Read), everything should work fine.

But in your system, sometimes the messages don't get through. You've put in expensive switches and cabling that should have enough bandwidth for a thousand of these controllers, but if network troubleshooting was easy they'd hire kittens to do it.

My first few recommendations are:

1. In your SLC-5/05, make sure there is a data table created and assigned to provide Diagnostics for Channel 1. That's one place that you can use logic to monitor for errors at the Ethernet port level.

2. Take a look at the SLC-5/05's embedded Web page. I don't have detailed experience/recollection of what's on that page but it's another place where you can get low-level information about the performance of the port.

2. Add logic that measures the time between /EN and /ER or /DN and puts them into a rolling array in the ControlLogix, for each MSG instruction. It would be useful to find out how long it typically takes for the messages to complete.

3. Set up a Mirror port on the switch that handles the SLC-5/05 and use Wireshark to capture some data there. You can compare your measurements in the ControlLogix ladder logic with the actual on-the-wire timing of the packets. In addition, intercepting that data as close to the SLC as possible will show you TCP/IP level failures (you'll see the sequence numbers getting out of order, which Wireshark flags automatically) and you'll see TCP/IP connections retrying, and timing out, and re-establishing. You will also be able to see if there are any floods of broadcast or multicast traffic that might be burdening the SLC-5/05 as it tries to examine and reject them.

4. Consider a Timing Method 3 that combines alternating read/write logic with short adjustable timers and manual application-level Timeouts. More on that later.
 
To be sure I was thinking about it correctly, I did a little example program to do a repeating read/write from a ControLogix to an SLC-5/05. It includes user-level Timeouts, and simple counters to keep track of the successful messages, the timed-out messages, and the execution time of each message.

Attached as a ZIP file. RSLogix 5000 v20, for a 1756-L61.
 
Ken,

Thank you for your replies and insight.


Switch Port setting to 10Mb /Half - I was wondering if this might be advisable, i saw some conflicting info on it. It makes sense from what you say, and the timeout errors seeming cyclical in nature, that maybe that is a periodic attempt to close connection and renegotiate.


Diagnostic File - These are not currently set up, can this be done online in a SLC (guessing no). So far i have been doing all of this remotely, and I am very hesitant to make changes requiring download while i am not there.


I will collect timing info on normal successful reads and writes and post.


Also, the only spare SLCs they have there are series B, so I ordered a refurbished 5/05 Series C (internet tells me this will definitely be 10/100Mb Full Duplex) from EBay and will try that as well.


The "Long Delay" now, with the timing shown in the logic i sent is approximately 1.5 seconds (attached DelayStart and DelayEnd trend pics show cursor at start of failing read and then at next successful read). Both messages fail each time there is a failure.


The attached OriginalRWTiming shows the logic that was running the MSG instructions originally. With this setup (and default .UnconnectedTimeout on the MSGs) the comms loss and delay was > 5 seconds about 50 times per hour.


Thank You,

Ruairi

OriginalRWTiming.PNG DelayStartTrend.PNG DelayEndTrend.PNG
 
I know that you have to be offline to add or resize a data table in the RSLogix 500 world (SLC/MicroLogix). I don't know if you can assign an already existing data table to be a diagnostic file while online.
 
Intermittent comms problems are hard to diagnose.

I ran that sample program overnight, with the timing turned down to 1000 ms intervals and 400 ms timeouts.

The messages to the SLC-5/05 (Series B hardware, but Series C FRN 11 firmware) completed successfully over 50,000 times, but there were 14 timeouts on the Write message and 1 timeout on the Read message.

I don't know why, so this is an example of my own diagnostic project.

It's probably not the SLC failing to respond to a message in a timely fashion, because it's running a nearly empty program with just target data tables in it. And the "Commands Received" and "Replies Sent" counters on the diagnostics webpage are counting up in perfect 1:1 synch and total.

But it could be due to the switch or the cables. They're just short cables I grabbed from a bin in the network room, and a cheap unmanaged desktop switch.

In my case, when I look at the Network Diagnostics webpage, I see that the Carrier Sense errors are increasing several times a minute.

http://192.168.1.163/diags/network.html

But that's normal on any half-duplex link. Ethernet and TCP/IP are generally sufficiently tolerant of that kind of collision that the data is quickly re-sent and the message gets through. Even though my Carrier Sense counter is increasing several times a minute, the timeout totals have been steady.

Once I reset the counters (this SLC has been up and running for months), I do notice that every time I refresh the diagnostic webpage, my Carrier Sense counter and my Packets Out counter are incrementing by the same amount.

So... off to do some more diagnostics of my own.

I think that your MSG instruction logic is probably working fine, and that you should look for diagnostic features at the Ethernet switch port level and the SLC or Logix port level.
 
Ken,
I appreciate your observations to compare to what i am seeing. My SLC is not empty, but is about 10ms scan time. Also i made sure the bit is cleared that lets it service multiple comms per scan, and tried sprinkling SVC instructions through the logic. None of this made a difference. So I agree it is probably not the SLC getting behind, something network related somehow.


I was hoping it was maybe the 10Mb Half Duplex that was the problem and a series C i have ordered would fix it, but would your test SLC with series C firmware be 10/100 Full? I thought it was at C they changed the Ethernet daughter card but maybe that is not correct.


Anyway, thanks again. I will keep adding anything else i find here.


Ruairi
 
The "Series C" designation for SLC-5/05's can be confusing, because you can load "OS501 Series C" firmware onto SLC-5/05 controllers that are physically Series A or B units.

Only the ones that came from the factory with the higher-performance Ethernet daughtercard, which are physically labeled Series C on the module, support 10/100 Mb Ethernet and Auto-Negotiation.

Those will always have "10/100 Ethernet" printed on the label next to the RJ45 connector, so you can distinguish them without powering down.

When I go back to the shop tonight I'll verify what I actually have running on my test bench.

Also: I think that if you do have a Series C unit that you've changed the speed/duplex settings on, an actual cold power cycle is necessary to apply that change.

The basic grid of diagnostic counters you can see on the webpage (and scrape with a utility if you wished) are what shows up in an Integer data file when you configure a Diagnostic File number in the RSLogix 500 program for Channel 1.
 

Similar Topics

Brand new L72 processor. 1756 DHRIO card in local slot 15 we have DH+ running to a SLC 5/04 grabbing a few integer files. Well since this new...
Replies
5
Views
2,938
I have a redundant ControlLogix being set up. This program reads a value from a remote site which happens to be SLC PLC. Rockwell mentions SLC...
Replies
2
Views
90
Hello, I have a ControlLogix redundant controller being set up. The program reads a value from a remote site which hosts a SLC PLC. Rockwell...
Replies
0
Views
67
Hi all, if I remember correctly, there is some way in a ControlLogix (or CompactLogix) where you can sort of map tags into SLC addressing format...
Replies
8
Views
1,132
A new Forum member resurrected an old post with a variation that I think should be done in a new thread to get the best attention and advice...
Replies
11
Views
2,345
Back
Top Bottom