Just a general question about water pumping

sparkie

Lifetime Supporting Member
Join Date
Nov 2014
Location
KS
Posts
1,148
So, I'm back at this stupid pump house again. Having the same conversation about starting up a second pump to maintain pressure. What it is, is a community cistern fed by a set of wells with two pumps in parallel pumping water out to the community system. Both pumps are driven by a VFD, but they are set up for redundancy, not to be ran in parallel.


The pump house floor and cistern bottom are on the same horizontal plane.


Now, when looking in to this, the conclusion I've came to is that it doesn't make sense to try and use the second pump to help maintain pressure, as the net gain doing this just isn't worth it. My thinking is this:


The pump wants to maintain a certain position on it's curve. The VFD is regulating the pump's rotational speed/angular velocity by using a pressure sensor for feedback. As far as the volumetric flow goes, the pipe diameter, fittings, etc are basically set.


So, when the pressure is dropping, it is because the velocity of the fluid in increasing, such as a fire hydrant opening or more people opening their taps.


But I am a bit lost from here. I'm not quite sure what happens when adding a second pump. Is it just introducing pressure into the system? I can't see it introducing pressure without also increasing the fluid velocity and losses.


Both pumps are on PI control, and I finally told the customer that I'm not an expert, but I don't think the juice is worth the squeeze and that I'm not the right person to tackle that job. I really don't think it will work, anyway but they won't accept that answer. The system was built back in the 60's and was originally an across-the-line starter.


Here are a couple pictures for reference:
https://i.imgur.com/Me1isJ9.jpg
https://i.imgur.com/Zhe6SO7.jpg
 
Adding a second pump may maintain pressure. To determine what will happen you need to plot some system curves and pump curves together. The intersection of the pump curve and the system curve identify the operating head and flow at a given set of conditions.

Several phenomena are in play:

- The system curve is the sum of the static head and the friction head. When hydrants etc. open the friction head drops and a new system curve is the result.

- Changing the speed of the pump changes the pump curve per the affinity laws.

- Operating two pumps in parallel creates a new pump curve, with the flows at a given head the sum of the flows of each pump at that head.

Perhaps the attached will help?

Thanks, I took a quick look at that. I'll take a closer look later. I just don't have the background knowledge to understand and apply it, and this isn't the type of system to learn on.

As an example, I don't know how I would go about plotting system curves and have repeatedly been denied any attempt at access to drawings for the original piping system. All isn't a wash, though.

I think I can ID the pumps and get the pump curves. How would I go about making a system curve or getting the necessary information? Then I might look further at running them in parallel.
 
Wouldn't this be similar to adding a booster pump in a residential home in order to increase the water pressure? Maybe adding another pump will work?
 
Two identical centrifugal pumps in parallel can, at best, double the possible flowrate without a pressure increase. This assumes no other losses. Two identical centrifugal pumps in series can, at best, double the pressure without a flowrate increase. This assumes no other losses.

You already know high flowrate is causing pressure loss. Running two pumps will provide the necessary flowrate to maintain pressure.
 
... How would I go about making a system curve or getting the necessary information? Then I might look further at running them in parallel.

The easiest way generally to get the system curve is to plot flows vs. head at several flows, assuming a fairly constant water tower level and typical system configuration in the number of users, etc.

As an alternative, you can talk to your plant operators. Municipal water systems try to operate over a fairly narrow range of head. You can probably make a go/no go decision by assuming a constant pressure, which means your system curve is a horizontal line.
 
So, when the pressure is dropping, it is because the velocity of the fluid in increasing, such as a fire hydrant opening or more people opening their taps.


To (at best) add to what @Tom Jenkins wrote:

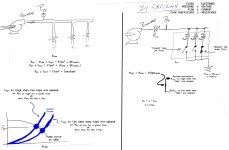
Pay particular attention to the last non-blank slide of @Tom Jenkins' PDF i.e. the pump and system curve: the numbers may change and the curves slide around a bit, but that plot will always describe the system qualitatively.

OP and others have it backwards: variation in pressure (e.g. at pump discharge) is a function of the system curve and the flowrate only, and it is set relative to atmospheric pressure (Patm). Full stop.

When pressure is dropping, it is because

  • EITHER flow coefficient (resistance) of system curve is decreasing (taps are being opened in the community) for (relatively) constant flowrate (velocity of fluid),
  • OR the flowrate is decreasing for a constant system curve (no change in number of open taps),
  • OR a combination of changes in those two parameters, flow coefficient and flowrate
    • N.B. However, pressure cannot decrease without at least one of them decreasing. Specifically,
      • We can never say "pressure is decreasing because flowrate is increasing."
      • When we observe that pressure is dropping while, not "because," flowrate is increasing, then the system flow coefficient must be decreasing more than enough to compensate for the increasing flowrate.
When the pump curve is included the process, there is a combination of several effects e.g

  • if pressure is dropping because
    • pump is pegged at 100% speed maximum,
    • and more taps are being opened
      • (i.e. so system curve flow coefficient is decreasing),
  • then the flowrate will increase,
    • as the pump at 100% responds to the decrease in discharge pressure.
See the attached image; pay particular attention to the relative number of taps opened (load) of the two blue system curves.

If OP is more familiar with electron than fluid flow, then start on the right side with the "pump" as a limited voltage power supply, and transfer to the left side by analogy. The form of the equation is different*, but the old British analogy of using "pressure" when describing voltage for electrical circuits has its place.

* first-order Ohm's Law vs. second-order Navier-Stokes equation reduced to Bernoulli's principle for an incompressible model

flow_vs_current.jpg
 
Last edited:
I wanted to thank you all for the replies so far. I'm still digesting the information.


That being said, as far as getting the system curve, there is no flow meter of any sort on this system. There is no access to any kind of drawings. The only measurement device on the entire thing is the pressure sensor.


Just for the record at this point, I did already let them know that I'm not messing with this. I don't know what I'm doing and don't want to get into it. I'm fine making small changes and repairs, as I've already replaced the old hard-wired controls with a PLC. I'm just not making heavy modifications to the PI loop the pumps run on. Especially when it comes to how the PI needs to be changed to run them both in parallel. They don't want them both running all the time. They want only one to run and then the second to start up when the pressure drops, and I'm not quite sure how the system would respond. That's another topic entirely though.


For now, I'm just using this as a concrete example of how to get a basic understanding of how to approach these kinds of problems. I'm in a control theory class this year and thinking about doing a pump controller for my final project, and I'll have to learn to model the system if I do.


Anywho, getting back to the system curve, it seems I need to have the actual measured pressure and flow to be able to figure out the system characteristics for the system curve. Is that correct?
 
I'm reading through all of this.


I see that flowrate is velocity. I always thought of flowrate as the volumetric flow. Is there a discrepancy there, or is it:


flowrate = fluid velocity != volumetric flow rate


If we are doing the electrical analogy, what is the analog for power in the system? I imagine it now as how much energy is contained in the fluid, and the pump as a power source (voltage in this case) that creates a pressure differential (delta-V) which leads to a movement of the fluid. I'm having a bit of a hard time wrapping my head around the energy balance there.


I'm trying to use, as a starting point, the idea that the fluid contains some gravitational energy, some kinetic energy and some internal energy, and that it needs to balance out with the heat transfer and work put into the system from the pump.


Also, I just thought I would include that I'll be going over there this week to get parameters from the VFD's to replace a non-functioning one, and I'm going to double check and verify there is no flow meter. If possible, I would really like to try and construct a system curve, at least a rough one, and play with it some. They might have one somewhere out in the field, but none of the water supply is billed out as it's just included in the rent. If they do have one, I'll synchronize the PLC timer with my phone's timer and record periodic samples to my raspberry pi and take time-stamped photos. It won't be *perfect, but I might be able to generate a rough curve to play with.


The number of users does change, but they aren't regularly adding/subtracting residences.


Is "Towel" level supposed to be "Tower" level? - if so, there are no towers. This is, if I recall properly, 4 well heads filling a cistern which shares a base level with the pumps. It is right on the other side of the wall behind the pumps. It's 13' if I remember correctly when I measured it last time.
 
Last edited:
If we are doing the electrical analogy, what is the analog for power in the system?

It's an energy balance.

  • Pressure is
    • force per unit area,
    • = force**1 length**-2
  • Volume is
    • length**3
  • So Pressure times Volume is
    • (force**1 length**-2) (length**3)
    • = force**1 length**(-2+3)
    • = force**1 length**1
    • - Force applied over a distance
    • = work**1
  • Switching to volumetric Flowrate:
    • Volume per time
    • = length**3 time**-1
  • Then Pressure time Flowrate is
    • (force**1 length**-2) (length**3 time**-1)
    • = force**1 length**(-2+3) time**-1
    • = force**1 length**1 time**-1
    • = work**1 time**-1
    • = Work per unit time
    • = Power
Water is incompressible, so the volumetric rate of water through the pump is fixed at any moment, and the pressure difference from the pump inlet to the pump outlet is the pressure rise, so the rate of work, i.e. power, added to the water = [Volumetric Flowrate] time [Pressure Rise].

There are efficiencies and other aspects here, but that is the basic, first-order model.

And as far as velocity, the water has a flowrate (length**3 time**-1) through pipes of a fixed cross-sectional area (CSA; length**2) at any one point, and that flowrate divided the CSA is (length**3 time**-1 / length**2 = length**1 time**-1) i.e. distance over time which is (mean) velocity or speed. I say "mean" speed because there is a profile of speeds across the pipe, stopped at the walls and fastest in the middle, dependent whether this is laminar or turbulent flow, but to first order that mean speed is what you are looking for, and note again that at any given section of piping there is a linear relationship between flowrate and velocity, because cross-sectional area is fixed in that section, so we use the terms velocity and volumetric flowrate more or less interchangeably, as long as we remember we are assuming an incompressible model to do so.

There is also a relationship between pressure and velocity that is based on energy balance (Navier-Stokes/Bernoulli), so if the water hits a run of pipe with a smaller cross-sectional area, the velocity goes up along with its kinetic energy (because it's going faster) so its pressure drops. But since you are measuring pressure at one point (and one cross-sectional area i.e. velocity) you don't really need to bother with that effect.

Finally there is pressure drop through the system from friction (straight runs of pipe, bends, tees, valves), and that pressure drop, when multiplied by volumetric flowrate, give the energy loss throughout the system. The exact details are far more complex than we need to go into, but the simple second-order model from my earlier diagram

Ppv - (Patm + ΔPstatic + Patm) = Csys * Flowrate**2


Where things like density, length of pipe, piping configuration, pipe roughness, Reynolds number, are all combined in that Csys constant.

So we can think of pressure as specific energy i.e. energy (or energy change) per unit volume.

It's all bookkeeping, in the end.
 
Last edited:
If you go to this link and look at equation 12.5
Work = Pressure ΔVolume


You will see the same thing. That assumes constant pressure, and I think it's actually
Work =  Δ(Pressure * Volume)


Everything is thermodynamics, of which the three laws are:

  1. You can't get ahead
  2. You can't break even
  3. You can't get out of the game.
;)
 
That makes a lot of sense. The classes I've taken haven't gone too deeply into it. Fluids is an entirely different class, and they don't really have classes on this kind of applied material at my school.


Anywho, so that's your I^2 * R for power, and that Csys quantifies the system-specific characteristics of whatever is out in the field.


So looking at this as Tom suggested, if I wanted to make that characteristic curve, I would want to record pressure and flow rate at given time intervals, and then plot this data and do a reasonable fit on the data to get a curve. I might even want to look at the data by time frame of the day. For instance the system will have a higher load at like 4-8 when most people are showering. Or 4-8 when a lot of people are cooking and doing dishes.


As has been mentioned, that Csys is changing, but I should be able to get an idea of the system's usage that way as well. It kinda sucks because it would be something cool to do, but there is no digital flow meter there that I can record data from.


Thoughts on this?
 
You could use the system as your flowmeter, although Csys change every time someone takes a shower.

  • find a time of day when pressure is steady and PI output is fairly constant
    • call this normalized flowrate 1.0;
    • calculate Csys as = (Ppv - (Patm + ΔPstatic)) / (1.0**2)
  • change pressure setpoint up or down, which will require the PI to increase or decrease its setpoint
  • Calculate normalized Flowrate = √[Csys / (Ppv - (Patm + ΔPstatic))]
  • Find other times of day when PI output is steady, and repeat, getting other Csys values, noting PI output for the target pressure setpoint.
  • Try to use a parameterized pump curve, and pump affinity laws (cf. @Tom Jenkins' PDF attachment) to those data.
I am not sure this will work; there may be too many unknowns. If you can get the pump curve for the pumps in question, it might be doable, assuming you also have pump suction pressure (the ordinate on a pump curve is pressure rise across pump, IIRC).
 
Last edited:
What you need is a Yaskawa IQPump control they can handle everything you need

https://www.yaskawa.com/products/drives/iqpump-drives/drives/iqpump1000

you could come close with what you use 2 pressure transducers one for each vfd
both vfd's run with a PID loop set to maintain the same pressure
set the lead to bring the 2nd pump online when the output freq reaches about 45 - 50 hz both vfd's will run at a much lower speed, and will increase when load demand increases as load goes down drop off a pump
don't forget pumps don't work very well below about 30 hz and above 70 - 80 hz you will overload the pump, so you have to fine the balance
but the best way oud be to us the IQPump control they are designed and tested to do exactly what you want
 
If there is sufficient storage in the tank that the pumps draw from, you can calculate a rough flow rate by stopping flow into the tank, and recording change in level over time. Assuming accurate measurements are possible from a sight glass or gauge.

Then flow rate = volume change over time. Do it in minute intervals if possible to measure level accurately.

Have excluded units as I can only understand that crazy metric system stuff and not the foot-pounds per square barrel of grandmas type units you guys over that side of the world use.
 

Similar Topics

Hi! I recently discovered how to get to configuration mode and disable printing for connecting to PanelBuilder32 and updating my Panelview...
Replies
1
Views
445
What do most of you set your motor overload setting on a VFD to? Say I have a powerflex 525. If it’s a 2 HP motor the FLA is 3.4 amps. So my...
Replies
19
Views
5,138
just wondering if anyone has worked previously on Citect SCADA 2015 (V7.5) before they upgraded Citect SCADA 2016 (V8.0). i have to upgrade my...
Replies
15
Views
8,418
Is Inbatch basically programmed similar to a PLC, it then reads/writes to a dumbed down PLC, which then performs the outputs? I'm having trouble...
Replies
4
Views
3,225
I am a new employee at a conveyor company and have been asked by 3 different people so far whether or not I have experience with beverage systems...
Replies
3
Views
2,304
Back
Top Bottom