Trying to find a website

ganutenator

Lifetime Supporting Member
Join Date
May 2002
Location
kansas
Posts
1,440
A long time ago, here, there was a link to an awesome website. It showed graphs for different PID control processes, and explained by looking at graphs, which tuning parameters needed to be changed, and in which direction. I have searched and searched, to no avail for this website.

Reason:
I have been reading the posts here on PID tuning, over and over and over, and have only been able to conclude the following: I must be an idiot.

Shouldn't I be able to JUST look at a graph of my process variable and setpoint over time, and be able to figure out wich tuning parameters need to be bumped, and in which direction, without taking a calculus class at night school. Trying to decipher these PID formulas are driving me mad.

taped_hen.gif
 
I have posted several PID tutorial sites.
http://www.expertune.com/tutor.html

http://www.jashaw.com/pid

http://www.intserv.com/pid.htm

http://rclsgi.eng.ohio-state.edu/matlab/PID/PID.html

I have more but cant locate right now, I will post more when I find them, hope one helps.

I dont do much PID stuff but have a few times, guess for most its a seat of the pants thing. I dont think every controller uses the same algorithm when dealing with PID thats why you have to experiment if not familiar with that particular controller. Tell you the truth I still dont fully understand it all but have made it work in both temp and motor control.
 
ganutenator said:
Reason:
I have been reading the posts here on PID tuning, over and over and over, and have only been able to conclude the following: I must be an idiot.

Give yourself a break. It takes specialized tools and/or lots of experience. In addition, there are many different forms of PID. Each form behaves differently.

ganutenator said:

Shouldn't I be able to JUST look at a graph of my process variable and setpoint over time, and be able to figure out wich tuning parameters need to be bumped, and in which direction, without taking a calculus class at night school. Trying to decipher these PID formulas are driving me mad.

Yes, but again, it takes experience. That is why I like simulators.
It doesn't require calculus to tune a system. Most control books talk about root locus and Bode plots. These are heplful to control engineer that know how to interpret them. I prefer minimizing the sum of errors squared.

There are some systems that are impossible to tune to get the desired results. It takes experience to recognize these systems too. Otherwise you will be.. banghead. These system are a result of poor design. ( I hate these, especially when the engineer thinks are poor design can be fixed with a better controller ).

Another important item is you must define a goal. Minimizing response times, steady state errors, or overshoot. Sometimes you can minimize one or two but not all three.

Another temperature PID
 
If tuning PID lops was intuitively obvious a whole market segment devoted to simulators, tuning methods, and "self tuning" PID controllers wouldn't be required. If you look at this site and any trade journal you will find thousands of trees have died and billions of bits shot through the web trying to explain this arcane and ubiquitious algorithm.

On site it has always been my experience that educated trial and error methods are ultimately required. Zigler Nichols etc. get you to a starting point for parameters, but so does experience and the manufacturer's default settings (I once read an article in "Control Engineering Magazine" that claimed 25% of the controllers he encountered were operating with the manufacturer's default tuning parameters!)

After years of experience with speicalized loops for a specific process I can look at the performance of a loop that is responding too slowly and immediately know I need to increase the gain, or maybe cut back in the integral term, or possibly eliminate the deriviative, or maybe a combination of the first two, or possibly all three, or ..... Because of my vast expertise and years of experience I also know when I am at the optimum tuning point because of loop performance, or I am out of patience, or the customer quit bitching, or the plant gate is closing, or my plane is scheduled to leave in two hours or .........
 
I think Tom makes some very good points here, especially the point about the plane leaving in two hours. ;)
The processes that behave according to the graphs you see in a book are typically the processes that will also behave reasonably well with default tuning parameters or Ziegler-Nichols results. The 'classic' graphs are basically generalities. As such they may be 'more or less correct' for your process. But it it also possible that the recommendation based on the PV graph will make things worse not better.

Like Tom said, it all comes down to experience. You have to play for a while to develop the experience to know what will help. And that statement is not limited to gain adjustments. It is quite possible something physical in your process may need to be moidified to get the performance you need. Again, experience is the key. Peter's comment about simulators is also very appropriate. A simulator can give you some experience without costing you anything in terms of actual product.

The big thing is don't get frustrated and don't necessarily throw in the towel too quickly. It's a machine. You DEFINITELY have more processing power than it does so you have the capacity to master it. When I started working with PID control I didn't have the math background or experience to support it either. But that will come with time. Luckily I came up in an environment where I was allowed to experiment and learn. That part is huge.

Again, as Tom said, define your goal before you start. Killing yourself to get rid of that last 0.5% process variation when you don't have to may be a fun exercise. It might also give you an ulcer if your manager is breathing down your neck.

Good luck.
Keith
 
tuning goals

Yo, ganutenator,

So far at least two or three responders have mentioned that you need to “define your goals” before you begin tuning. You probably already know what they mean by that - but just in case you (or more likely other readers) don’t have a clue what a tuning “goal” is, I’ll try to give an overview of the major concepts involved. This is a “broad-brush” approach - and as always every rule has its exceptions - but I think that what follows is a good way to get started.

Note: The figures shown below are just “hand-drawn” sketches which I knocked out in Microsoft Paint. I decided not to put any actual PID tuning parameters on them - there would be too many ways to misinterpret the values - due to differences between brands and models of controllers. We’re just going to talk about the major differences between the curves.

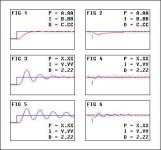
Suppose that we walk into a plant and see the following trends printed out and pinned to the bulletin board - something like a “Tuning Wall of Fame” for visitors to admire. Let’s suppose that these graphs represent examples of temperature control systems for a large oven. And keep in mind that all of these graphs represent different tuning adjustments for the SAME oven.

[attachment]

First let’s take a look at figure 1. This trend tells a story of the oven temperature being controlled at a certain setpoint - when suddenly the operator cranked the setpoint up to a higher value. The controller automatically responded and eventually brought the temperature up to the new setpoint. (By the way, the “setpoint” is the “target” temperature - shown in blue on the trends.)

Next let’s move down and take a look at figure 3. Same story. Here the oven temperature was being controlled at a certain setpoint - when suddenly the operator cranked the setpoint up to a higher value. The controller automatically responded and eventually brought the temperature up to the new setpoint.

Now let’s compare figure 1 to figure 3. Notice that the setpoint changes in each of these trends were identical. But look at the differences in the two temperature responses. Figure 1 shows a system which recovers from the setpoint change with little or no overshoot - and with little or no oscillation. Figure 3 shows a system which responds to the same upset with quite a bit of temporary overshoot - and gives several oscillations before it finally settles down again.

Trick question: Which trend (figure 1 or figure 3) represents the better tuning? Now most people would place their bets on figure 1. Compared to figure 3, this response looks a lot smoother and appears to be under much better control. But the correct answer is: We can’t tell. Until we know what the system is supposed to do - our “goal” - we can’t make an educated decision about which of these two tuning solutions is the one which will really give us the optimum control for our system.

Let’s continue on by looking at figure 2. This trend tells a story of the oven being controlled at a constant setpoint - when all of a sudden, the load on the oven is suddenly increased. Perhaps someone opened the oven door and put in a new batch of cookies. The exact time of the load increase is noted by the tick mark. Notice that when the load on the oven increased, the temperature started to decrease. But then the controller automatically responded and eventually brought the temperature back up onto the setpoint.

Now let’s move down to figure 4. Here we have the same story. The load on the oven increased - the temperature decreased - and the controller automatically responded and eventually brought the temperature back up onto the setpoint.

Now let’s compare figure 2 with figure 4. Figure 2 looks a little sluggish doesn’t it? When our controller is tuned using the values A.AA/B.BB/C.CC it takes the controller a lot longer to get the temperature back on target. In figure 4, we’ve tuned our controller using the values X.XX/Y.YY/Z.ZZ and our controller is much more “aggressive”. It gets the temperature back on target much quicker.

Notice that the tuning values A.AA/B.BB/C.CC are the same in figures 1 and 2 - and the tuning values X.XX/Y.YY/Z.ZZ are the same in figures 3 and 4. Now we’re ready to talk about one of the major “trade-offs” in PID loop tuning.

If we tune for a nice, neat, no-overshoot response to a setpoint change (as in figure 1) - then we’re going to pay for that with a sluggish response to a load change (as in figure 2). On the other hand, if we tune for a quick, aggressive response to a load change (as in figure 4) - then we’re going to pay for that with overshoot and oscillations when we make a setpoint change (as in figure 3).

So - whenever you think about your tuning “goals” - one of the things you need to decide is whether you want to optimize your system for load responses - or whether you want to optimize it for setpoint changes.

Suppose that we’re trying to define our tuning goals - and our oven ALWAYS bakes at 350 degrees F. - then the only upset to the system is going to be load changes. In this case we’d undoubtedly choose the tuning values used in figures 3 and 4. After all, who cares if a setpoint change would give us overshoot and oscillations? We’re never going to change the setpoint anyway.

But suppose that our process cannot tolerate any overshoot or temperature oscillations. Then we’d want to dial in the tuning values used in figures 1 and 2. Sure - our response to load changes is going to be a little more sluggish than we’d like - but that’s the trade-off we’ve got to make.

Now let’s “flashback to reality” - suppose that the boss INSISTS on having his cake and eating it too. He demands the smooth response to setpoint changes shown in figure 1 - but he also demands the quick, aggressive response to load changes shown in figure 4. Many engineers would just try to adopt a set of “compromise” tuning values - something in-between A.AA/B.BB/C.CC and X.XX/Y.YY/Z.ZZ. But not people of our caliber. Since we’re working with a PLC (and not one of those dinky little single-loop controllers) we can have the best of BOTH worlds. Suppose that we program the PLC so that anytime we have a setpoint change - it will automatically move the values A.AA/B.BB/C.CC into our PID controller. That gives us the desired response shown in figure 1. And we also program the PLC so that once the system has settled down near the setpoint - it will automatically move the values X.XX/Y.YY/Z.ZZ into our PID controller. That gives us the desired response shown in figure 4. We’re only talking about two rungs here folks - and now we can offer the boss a system which will automatically adapt to various tuning requirements.

I think I’ve got time to discuss one more trade-off - “stability”. Suppose that the boss now wants to crank the system up a notch - to a higher setpoint as shown in figure 5. Notice that the tuning values X.XX/Y.YY/Z.ZZ which served us so well in figure 4 - now seem to be a little TOO aggressive at this higher setpoint. This is what happens to most systems when you force them to “work harder”. Notice that we’re making the same amount of setpoint change in figure 5 as we did in figure 3. Specifically, the “jump” in our setpoint “spanned” the same number of degrees. But the final temperature that we end up with is much higher in figure 5 - and (oops!) now our controller gives us a response which has a greater tendency to oscillate. Many engineers would decide to “back-off” the tuning adjustments in this case - to compromise. But that would mean that our system would give us a less-than-optimum response when the setpoint was eventually brought back down to the “normal” range shown in figures 1 through 4. Suppose that we really want to impress the boss - I’ll bet we could come up with a better solution.

I hope that this will help some of you - I know that it would have helped me when I first got started with this stuff. For example: The first PID book that I studied referred to the tuning shown in figure 3 as “tight” tuning. Well, it sure didn’t look “tight” to me - and I always thought that the book had a misprint. Years later I realized that they were talking about a “tight” response to a LOAD change - which is the result of the same values used in figure 3. They just never showed figure 3 and figure 4 side-by-side. Live and learn.

Finally, I’m SURE that other responders can offer more detail (and quite possibly some corrections) to what I’ve had time to include here. Party on.
wall of fame.jpg
 
Thanks for the nice reply, Ron Beaufort. A picture IS worth a thousand words.

Now, for the 100 dollar question...

I have a hard time trying to figure out which tuning parameter to change, to get my graphs to look the way I want.

For example, does figure 5 represent too much gain (PB too low) or too many repeats per minute, or both? Which parameters would need to be adjusted to go from figure 1 to figure 3? I am not too interested in adjusting Derrivative at this time. All of my applications seem to be flow or pressure based, or both (cascade, ugh).
 
To fight this battle with your hands tied.

ganutenator said:

I have a hard time trying to figure out which tuning parameter to change, to get my graphs to look the way I want.

For example, does figure 5 represent too much gain (PB too low) or too many repeats per minute, or both?

Because the PV is increasing in rate as it reaches SP I think the integral gain is to high relative to the differential gain. The proportional gain is probably too high too.

ganutenator said:

Which parameters would need to be adjusted to go from figure 1 to figure 3?

Less P and I and more D.

ganutenator said:

I am not too interested in adjusting Derrivative at this time.

Why? The differential gains adds damping which is what you need to get a system that looks like fig 3 to look like fig 1. Increasing the derivative term provides the sluggish response the Ron mentioned.


ganutenator said:

All of my applications seem to be flow or pressure based, or both (cascade, ugh).

I tune a lot of hydraulic pressure PID systems. Differential gain is the key.

RSDoran post a good link a while ago

PID Tutorial

I use this page to explain PIDs to our people. However, these equations still need to be explained because their true meaning is not obvious.

The key to these equations is the denominator. If the roots are imaginary then the system will overshoot and ring. In the proportional example one can see that increasing the gain will at first be beneficial until the gain Kp = 5. At this point the roots/poles become imaginary and there will cause the system to ring.

S^2 + 10*S + (KP+20) will have to real roots from 0 till Kp = 5. At Kp = 5 the system will be critically damped. Beyond that the system have imaginary roots.

In the proportional-derivative section the denominator looks like this:

S^2 + (10+Kd)*s + (20+kp)

If Kd = 2 then Kp can be increased to 16 and still be critically damped. In this case the system will reach the set point in 5/6 the the time compared to the proportional only case where Kp must be 5 to be critcally damped.

If Kd = 4 then Kp can be increase to 29 and still be critically damped.
 
Yo, ganutenator,

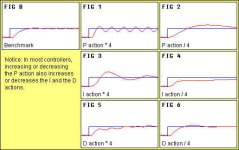
Six or seven years ago I was asking the very same questions you’re asking today - and nobody seemed able to give me a straight-forward answer - so here’s what I did. I went to the lab and built a small experimental heat system - and connected it to an Allen-Bradley PLC-5/15 processor. I carefully (laboriously - tediously - over a period of several days) tuned and retuned the system until I got it to look like the “Benchmark” in Figure B. Then I said to myself, “OK - I’m going to consider this to be a PERFECTLY tuned system.”

[attachment]

Next I increased the Proportional action by a factor of 4 - and the result was something like Figure 1. Then I decreased the Proportional action (from the original benchmark setting) by a factor of 4. The result was something like Figure 2. Well, you can already see a pattern developing - just follow your heart for the rest of the figures.

Now all of this may seem simple enough. I figured that once I had my “too much of this - too little of that” trends to work from, then tuning systems would become a very simple procedure. In the future, all I would have to do is just look at a trend of the new system - find its pattern in my “mug shot gallery” - and then adjust the proper P, I or D setting in the proper direction.

Well, it ain’t quite that simple.

In most controllers, when you increase or decrease the P setting, you automatically increase or decrease the I and the D actions also. That means if you took the settings for Figure B and simply increased the P action by a factor of 4 - then you will probably NOT get anything which remotely resembles Figure 1. That’s because (using most controllers) your adjustment to the P setting would have also increased the I action and the D action - each by a factor of 4. So in order to duplicate the results of my figures above, you would be required to make some rather tedious “compensatory” adjustments to the I and the D settings.

Now Allen-Bradley PLC-5 processors (but not the SLC or MicroLogix families) allow you to select what the book sometimes calls the “AB Equation” - and at other times it’s called the “Independent Gains Equation”. Using this particular equation it IS possible to increase or decrease each setting (P, I, or D) independently of the others. This is basically how I was able to isolate the actions of the three PID components for the figures above.

Going further - not only does the P setting affect the I action and the D action - there are other factors which make this “follow the chart” approach a lot trickier than most people would think. As we’ve mentioned in other posts, each individual system has its own peculiarities and characteristics. But still - you’ve got to start somewhere - right?

So yes, I know exactly what you’re asking for - and after six or seven years of searching, the figures above still represent the best solution I’ve been able to come up with for a simple answer to the question which every process control technician asks: “Which setting do I need to change - and in which direction do I need to change it?”

Disclaimer to everyone: The figures shown above are free-hand sketches - they are very close to the actual results of my personal experiments - but once again - they are JUST sketches.

In closing, please consider this material to be a starting point - and not an “end of the rainbow” solution.

pid adjust.jpg
 
Last edited:
Great graphs, Ron. This illustrates very clearly what I was trying to demonstrate humorously - that there is always a significant amount of "cut and try" in any PID loop tuning. Experience lets you eliminate the really bad guesses, but neither experience or Ziegler-Nichols or any other trick will let you pre-determine exact tuning. Furthermore, you have to change the tuning when the loading changes or you aproach upper or lower limits of the process or you run two pumps instead of one or .......

This is precisely why I avoid PID loops when possible. It is difficult to tune (almost impossible for the rank novice) and requires constant re-tuning. I use a lot of floating control Do a search on this site - Terry and I and others have discussed this extensively in the past.
 

Similar Topics

I am trying to download RSEmulate500 today. The website seems to be partially down. I can get some places, but not there. Can someone point me in...
Replies
5
Views
2,068
I am trying to find an Omron FB _CP2E030_SendModRTU_F06_P1 but cannot find it anywhere. Would anyone have a link at all please?
Replies
2
Views
1,999
GE RX3i CPE305 serial port configured as "RTU Slave", trying to find address info Hi guys, I'm working on a system with a GE CPE305 and the...
Replies
4
Views
2,590
Need some help finding an panel mounted touchscreen monitor. Roughly 12", close to a 16:9 (widescreen) ratio. Takes 24vdc power, DVI or HDMI, and...
Replies
8
Views
2,728
We still use the Weinview/Weintek MT200D HMI and I can't find the easy builder software that will connect to the HMI. Anyone know where I can find...
Replies
8
Views
2,680
Back
Top Bottom