Slow Acting Long Time Interval PID Tuning

The data plotted below are from the OP of this thread. The data provided via an eXcel workbook are similar if not identical.

Is anyone else curious about, or baffled by its character? I am referring specifically the sharp "V" reversals at the minima, where the valve runs out of controllable range as it is fully closed, compared to the smooth reversals at the maxima, where the valve has plenty of range. The contant rate of rise after the V is understandable, as the OP explained that the media heat itself, presumably via an exortherm. But those data before the V are puzzling. Another aspect of is that the temperatures indicate the cooling is constant, if not accelerating, as the valve is closing (when I would expect the cooling to be decreasing) right up until the point the valve closes, which is immediately before the V minima


I'm sure it can be modeled mathematically, but I have been trying, without success, to come up with a physical model to explain this behavior.

Is it possible that the glycol coolant valve sticks at its maximum open value until it is is commanded to fully close (at ~7ma)? Or could this valve have a fast-opening characteristic?


Perhaps the glycol coolant is in a resevoir itself and the temperature of the glycol entering the tank cooling jacket is not constant, and drops in temperature as the chilling system comes up to speed, and then rises in the reservoir when the flow is zero.


attachment.php
 
Last edited:
Is anyone else curious about, or baffled by its character? I am referring specifically the sharp "V" reversals at the minima.

I'm sure it can be modeled mathematically, but I have been trying, without success, to come up with a physical model to explain this behavior.

Is it possible that the glycol coolant valve sticks at its maximum open value until it is is commanded to fully close (at ~7ma)?
attachment.php
@drbitboy, I think you mean ~7% PID output, not 7mA


For modelling just general valve sloppiness or backlash, try something like:
Code:
IF AnalogOut_mA > (ActualValvePosition_mA + 1.5mA) THEN
    ActualValvePosition_mA := AnalogOut_mA - 1.5mA;
ELSIF AnalogOut_mA < (ActualValvePosition_mA - 1.5mA) THEN
    ActualValvePosition_mA := AnalogOut_mA + 1.5mA;
END_IF

ActualValvePosition_mA  | % FLOW
5.5mA                   | 0%
18.5mA                  | 100% Flow


It might not be as bad as 1.5mA, but you can plug your own numbers in.
 
Another trick that can be used to free a sticky valve is to super impose maximum or minimum output for one scan when the control output changes direction. The problem with this method is if the direction changes due to noise when. The dead time still looks too long. at about 2 pm the valve opens up to start cooling and at about 4 pm the temperature starts coming down.
 
I do mean 7ma; the OP confirmed it. Twice cf. Post #74 and Post #70.

Oh I apologise. I interpreted your sentence as "gets stuck at 7% when the valve is commanded to close." Instead of what you actually wrote.
When the PID output goes from 1% to 0%, the mA is set to 4mA, and that explains the sharp V.
#14

I think my confusion came because the valve is not commanded to fully close at 7mA.
 
Last edited:
Oh I apologise. I interpreted your sentence as "gets stuck at 7% when the valve is commanded to close." Instead of what you actually wrote.
When the PID output goes from 1% to 0%, the mA is set to 4mA, and that explains the sharp V.
#14

I think my confusion came because the valve is not commanded to fully close at 7mA.


No problem. Actually, my interpretation of OP's narrative is that when the PID outputs a value in the range [0-0.5)%, it is rounded to 0% and offset approx. 19%, so the output signal is just under 7ma (around 19% of the 4-20ma range), which corresponds to the largest position signal where the valve does not pass any flow.


PeterN's post a few days ago showed video about a similar valve characteristic, where the output flow was 0 from 0-20% of the valve position range.


And I don't think that explains the V. What is the physical explanation for the cooling not decelerating as the valve is being closed? I would have thought tens of minutes of deadtime (not lag), but the V (discontinuous slope change) happens within just a few minutes of the output going to zero, and the slope of the rise is very flat, consistent with an exotherm and no (or constant) cooling.
 
Yes I have thought about backlash, even tried to model it.


Any valve characteristic (e.g. backlash) has to explain

  • System responds immediately (with lag) to CV increase from 0% to 1%
  • System shows steep cooling with no deceleration when CV decreases from 5% to 1%
  • System goes from steep cooling with no deceleration to no cooling when CV decreases from 1% to 0%.
Maybe the valve has two positions

  • CV=0% (valve positions around 0%=4ma; closed; no cooling)
  • CV=1% (valve position around 20%~7ma; open to do enough cooling to overcome the exotherm)
  • Backlash to the point that all the variation in CV above 1% does not change the valve position.
  • In effect it's bang-bang control.
 
I don't see how anybody can say the dead time is close to 0.
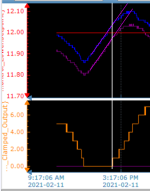
From the plots above I see the orange output start to increase before 3:17PM There are 6 hours between the vertical markers so the control output must start increasing before 3PM.
The temperature starts dropping AFTER 3:17PM. It look like the temperature starts drop about 30 minutes AFTER 3:17PM. This means the dead time is long. About 45 minutes. That is too significant to ignore.
 
When I look at the trend and see the PV change direction shortly after the CV reaches zero, my inclination is to think that there might not be too much pure deadtime. If true, and the CV has room to work, it could very well be possible to significantly reduce or eliminate the amplitude of oscillation.
Post #11
 
I'll unhorse that windmill yet ...

Ahh, debating the measurement and analysis of data. This is the first sub-topic where I am close to being on equal terms with y'all. As my brother says, there are people who should design, use, and analyze the data from, measurement systems, and there are people who should not*.

* not that I am saying anyone here is of the latter, but I rather unashamedly think myself of the former, allowing for the occasional mistake. So without further eloquence (cf. here) ...

"Applying**" and extending @AustralIian's definitive methodology and original work on the matter in Post #33 to the transition @PeterN mentions at 3:17PM, we see the image below.

** good writers borrow, great writers steal ;)

The blue data are the PV, and their response is detectable within 17minutes***, perhaps less if not rounded to 0.01, and nowhere near 45minutes.

*** Deceleration of temperature rise is detectable at ~17pixels after CV step from 0, and 375pixels=6h here. So 17pxl = 17*1*1 = 17pxl * 6h/375pxl * 60min/h < 17min

The magenta data are another temperature sensor, so almost certainly at a different location. Anyway, the offset is less interesting than the character: the dropoff starts with no discernible deadtime.

I freely admit I am guessing here, but if the model is heat flowing to the coolant in the jacket from the bulk media (magenta), and to the bulk from the thermally-isolated-from-the-jacket PV (blue), any interpretation of deadtime in the blue could also be long, cascading time constants. Two-digit rounding makes it difficult to detect the difference between that and actual deadtime, but I think we can say 20minutes is an upper limit.

Whether that is "close" to 0 or not is semantics.

AustralIan_image_hacked.png
 
From the plots above I see the orange output start to increase before 3:17PM There are 6 hours between the vertical markers so the control output must start increasing before 3PM.


The controller output may start earlier but the rounded, clamped output does not move the valve until the time shown.


Any deadtime* in the initial valve movement, caused by the rounding, will be partially if not fully compensated for by the valve stepping all the way to 1% when the CV output goes past 0.5%.


* of the control system, not the process, although of course the two are part of the same system.
 

Similar Topics

Hey guys, I have a Controllogix and I am tying to control a PID loop for Chlorine (CL2). The trouble is the mixing point is 15 minutes away from...
Replies
16
Views
6,747
Anyone have issues with RSLinx being very slow to open. It sometimes will say "Checking Activation" at the bottom for what seems like an...
Replies
2
Views
121
Hi All, we've recently upgraded from FTView SE v10 to v12. Since the upgrade we've been having a problem where the HMI is slow to update tags in...
Replies
0
Views
85
Hi, I have some problem with View Point which I'm using to manual control of conveyors. On begin when in network was only PLC and HMI View Point...
Replies
0
Views
67
Hi. Importing a 2014 aapck in 2023: no problem using it, adding windows, works very well, no problem whatsoever. Creating a new project: as...
Replies
2
Views
726
Back
Top Bottom