PID Control of Non Linear Ball Valve

Join Date
Jul 2007
Location
Kiruna
Posts
600
Hi All,

Has anyone any experience in controlling a non linear valve with a PID?

Traditionally this valve is controlled on flow but would like to experiment with pressure and omit the flowmeter eventually.

What I am trying to achieve is a stable pressure differential across the valve so will install 2 pressure transmitters.

As the ball valve to be controlled is nonlinear I was hoping for some ideas on how to achieve this. I am using an AB Compactlogix with the PIDE instruction contained in a PlantPAx wrapper AOI.

I have a valve open position v flow model from the valve manufacturer and can see clearly it's nonlinear.

Secondly if I can achieve this form of control I would like to calculate the flow. From a test from valve supplier I can see the flow vs valve stroke position in steps of 5%.
Is anyone aware of a calculation to get flow for this so I can break it down over 100 points instead (1 % steps) instead of 20 points (5% steps).
 
Hi All,

Has anyone any experience in controlling a non linear valve with a PID?
No but my customers have with our controllers. These ball valve had motors and were fast.


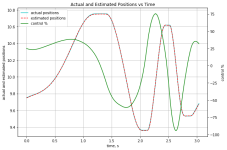
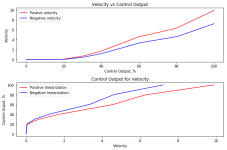
I can do this easily. Here is an example of linearizing a valve. No one showed me how to do this. Now I have non-linear transfer functions for that valve and can compensate for the non-linearity.
valve3 response.png

Valve3 control vs Velocity.png
What info did I have that you haven't provided?
 
experience in controlling a non linear valve with a PID?
Are you


  • controlling the valve itself i.e. a valve positioner,
  • OR
  • controlling a flow (or pressure) across a wide range of values where the gain of the system varies, so a single set of PID tuning parameters may not work?
test from valve supplier ... flow vs valve stroke position in steps of 5%. ... break it down over 100 points instead (1 % steps) instead of 20 points (5% steps).
The reason someone would stop at 5% increments should be that interpolations would work for intermediate points, so linear interpolation would be my first attempt; the code for a AOI-less PLC would be ugly but doable. Higher order approximations are also possible: if it's reasonably smooth then less than half a dozen, maybe three or four, Chebyshev coefficients polynomial might be adequate. Still ugly in the PLC, but adequate.
 
Are you


  • controlling the valve itself i.e. a valve positioner,
  • OR
  • controlling a flow (or pressure) across a wide range of values where the gain of the system varies, so a single set of PID tuning parameters may not work?
The reason someone would stop at 5% increments should be that interpolations would work for intermediate points, so linear interpolation would be my first attempt; the code for a AOI-less PLC would be ugly but doable. Higher order approximations are also possible: if it's reasonably smooth then less than half a dozen, maybe three or four, Chebyshev coefficients polynomial might be adequate. Still ugly in the PLC, but adequate.
`

Yes controlling the valve with a positioner. I'm open to any means of controlling it not necessarily PID. My thinking was to use the differential pressure across the valve (1 Bar) as the SP for the loop. Is this achievable?

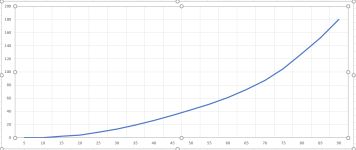
Attached is the % Open valve stroke V Flow m3/min.

For the flow calculation I'm pretty sure it will be inaccurate, question is by how much? It's just an approximation of air consumption during a period.

Valve Curve.PNG
 
`
Attached is the % Open valve stroke V Flow m3/min.


There is some info missing there: what is the fluid (sounds like air); what are the pressures up- and down-stream of the valve; what is the temperature of the air?


Change any of those (possibly others e.g. whether this is choked/sonic flow) and that plot changes (not the characteristic so much, but certainly the ordinate values)


That looks like an equal-percentage valve, or very close to one, which is what you want to control flowrate cf. https://instrumentationtools.com/valve-characteristics/; the flow formula (from that URL) is based on


instrumentationtools.com_control-valve-formula.png


Where [x] is the the valve open fraction (= 0.01 * percent_open) , R is a constant for the valve, and f(x) is the flow as a fraction of flow at 100% open.


Linear interpolation should be fine over that range, or you could try a least-square fit to determine R and use that to model the flow.
 
Last edited:
Why wouldn't PID control compensate non linearity?


It depends on the valve and process characteristics and expected range of operations.


A valve followed by a long run of pipe will take most of the total system pressure drop at low flow rates, but at high rates the bulk of the total system pressure drop will occur in the pipe, so the response (gain) of the process to changes in flow through the valve will vary, so tuning parameters that will work at high flow rates may be unstable at low flow rates.


"Know thy process."
 
What I am trying to achieve is a stable pressure differential across the valve so will install 2 pressure transmitters.


Why not a single differential pressure transmitter, which may reduce noise compared to a difference between two transmitters' readings, since differential is what you are trying to control?
 
It depends on the valve and process characteristics and expected range of operations.


A valve followed by a long run of pipe will take most of the total system pressure drop at low flow rates, but at high rates the bulk of the total system pressure drop will occur in the pipe, so the response (gain) of the process to changes in flow through the valve will vary, so tuning parameters that will work at high flow rates may be unstable at low flow rates.


"Know thy process."


True, also if valve is oversized, then controlling low flow is difficult.


Or if there is butterfly valve and slow electric driven actuator instead of ball and air actuator. (as they are cheaper)

Luckily these need usually only slow PID so non linearity is only one problem.
 
The only experience I have with (in my case) controlling flowrate with a ball valve was a bad one.

I had been told that it was a special ball-valve, with an offset semi-spherical ball, that made it easier to achieve good control over a wide range of flows.

Try as I might, I could not get PID parameters correct, and had the opportunity to try re-tuning over several days (batches came every 3 hours or so).

In the end I had to conclude that there was something wrong with the valve itself, and managed to persuade the project manager to get the manufacturers in.

Cut a long story short, it transpired that the valve had been installed incorrectly, and the flow was going in the opposite direction to it's intended, and designed-for, flow.

A few hours later, after the pipework crew had turned it round, we had another go, and I was able to tune it to an acceptable performance, over the next 2 batches !
 
Warning! Warning! Warning. Grumpy Engineer being a grumpy engineer.

The OP didn't say what fluid he was controlling.
The OP didn't say if he had position feedback.
The OP didn't say if the ball valve was motor driven, most are but I don't like to assume. The valve could have its own controller. There is a huge difference. A servo valves requires you give it a current or voltage proportional to the opening or position. A motor controlled valve requires a signal proportional to the speed of the valve and this must be integrated to provide position.


The OP has the flow vs valve opening but he doubt it. There is a very good reason. Even Rexroth valves are accurate +/- 10 percent according to their spec sheets. That is why I have learn to determine transfer functions for a valve on my own as shown above.


If x is the valve position, k(x) is the flow coefficient as a function of the position. The flow coefficient has units of m^3.5/kg^0.5


The equation the OP needs to solve is

Q(x)=K(x)sqrt(ΔP) where ΔP is the 1 bar differential pressure he wishes to maintain. Q(x) is the flow.


This is a prime example of the OP not providing all the information and why I don't answer a lot of questions that I could solve in seconds.


Now why are the basic metric units for a flow coefficient m^3.5/kg^0.5 ?
 
Hi All,
Traditionally this valve is controlled on flow but would like to experiment with pressure and omit the flowmeter eventually.

What I am trying to achieve is a stable pressure differential across the valve so will install 2 pressure transmitters.

An effective method to improve PID control performance with a non-linear final control element, such as a valve, is to manipulate the PID output before sending it to the valve. The objective is to create a linear response in the process measurement (e.g., flow) over a wide range of controller output.

The benefit of linear process response is constant process gain, meaning PID gains will have similar impact across the whole working range of the final control element. Otherwise it becomes necessary to tune in the non-linear range where process gain is largest, and then have to accept slower closed-loop response where process gain is lower (i.e., smaller slope on the PV vs. CO graph).

In this example there is a PV vs CO chart in post #5, which as suggested by drbitboy, has the equal-percentage appearance. Ideally this data would have been directly measured with the PID loop in manual by stepping the valve through the full CO range in 5 or 10% increments. For the sake of this remaining discussion, assume that it is actual PV vs CO measurement.

If the OP was interested in flow control, this data is a very good first step because it can be used to in the linearization strategy. The idea being to invert the function, such that when the PID CO is applied to the inversion, the resulting modified CO is sent to the valve to get the linear response.

The inversion function can be a linear piece-wise function, or a continuous function. In the attached PDF I estimated the PV (flow) vs. CO data from post #5 to create a forward model based on the equal-percentage valve form. These are the dark blue and orange traces.

Then I created an inversion model to approximately reflect the forward model across the diagonal. The inversion model is the gray trace, which references the second y-axis. As a test of this model the original set of equally-spaced CO values (0, 5%, 10%, ...) are converted to linearized outputs (i.e., along the gray line) and fed back into the forward model to estimate the flow response, shown as the lighter blue trace.

The result is not perfect, but much more linear than the original response. In a real application, I would spend more time tweaking, but for the purpose of this illustration it is good enough.

Getting back to the OP's objective of converting from flow-based control to differential pressure-base control: the same principles apply, it is just that a PV vs CO is needed after the new pressure transducers are installed. If the measured response has a similar non-linearity, then an appropriate inversion function can be created to get a linear response over the CO range. The only difference will be units of measure and potentially the form of the forward and inversion functions if the equal-percentage model is no longer sufficient.
 
Last edited:

Similar Topics

Hello. I have an application where I'm controlling a spindle motor as a yarn package builds in diameter. As the diameter increases the motor...
Replies
25
Views
9,487
I am trying to build ladder logic in rsl5k to turn on a contactor with a digital output. I have a 1769-IT6 input card and a 1769-OA16 output card...
Replies
8
Views
1,948
I have S7 1512C controler for controlling 48 PID temperature loop, the output is PWM. Please I need the best, most efficient way to write the...
Replies
13
Views
591
Hi all, I'm having trouble solving a problem I've been working on for several months, and thought you might like a stab at it. The machine runs...
Replies
22
Views
926
How can I connect PID Output to a valve. In ladder logic program is there any logic do I want to add between valve and PID? PV=SP What will be the...
Replies
7
Views
409
Back
Top Bottom