Graph in RSView32 or Factory Talk

escoplcguy

Member
Join Date
Jun 2010
Location
New Jersey
Posts
191
Hello All!! I need to build a graph showing on the x (horizontal) axes my tag for distance and y (vertical) axes my tag for load. I did have a trend set up but on the x axes i could only display time and couldnt change that value.

if this possible on rsview and if not is it possible in factory talk??? thank you all!
 
Hi,

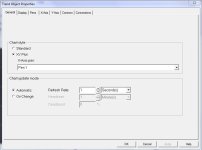
I haven't tried this, but just looking at the General Tab for a Trend, you can select a "Standard" or "XY Plot" trend.

If you select a "XY Plot" trend, you can then select a PEN (say PEN1) to use for the X- Axis.

Under the connections tab, you can then assign a tag to PEN1...

Does this help?
See attached

x-axis.JPG
 
I've never been entirely happy with the X-Y Trend feature of the TrendX object. You can make it work but it takes a lot of effort to make it do anything except time-based trending.

Even though you can define a non-Time variable for the X axis, the object still behaves like a Trend: it draws a line between X,Y coordinates that it samples on a timed interval.

To draw a "graph" or "chart" I have to open the object and then "feed" it data points one at a time every few hundred milliseconds until the graph is full. That makes it a big tradeoff between how fast I want the graph to appear and how many data points I can show.

My most common problem is when the display containing the object comes up and my values are back on the 0,0 point.... the line happily gets drawn to the beginning of the graph, then back to the middle of my data set... it's a mess. And there's no way to disable graphing effectively (I suppose I could stop the data model, then re-start it, but that is by no means a precise method) and no way to clear the display other than using a non-historical tag set and closing/re-opening the window.

Has anyone used an ActiveX object other than TrendX, from RA or another vendor, inside RSView32 or FactoryTalk View ?
 
i would like to try this but i cant seem to figure out how to get a new trendx object...i have trendx instaled on my machine cause i can view the trendx demo but i cant figure out how to start a new one in a new graphic.....any help?
 
Try this:

Go to the Pens section and add the tags you're going to use as "trend pens", then exit and re-open the RSTrendX object.

The creation of the pens means there will be a data source for the X-axis, which enables its selection.
 

Similar Topics

I have an application that I need to draw a simple XY graph. I am gathering up to 6000 data points in a Control Logix L61. I need to graph those...
Replies
3
Views
2,530
Hi, I am trying to replace a daily chart recorder (obsolete paper style) with a RSView Trend. I have the 24Hr trend working but I need to...
Replies
0
Views
1,905
Hi guys, I have 40 entries of force vs position for each product we produce. We want to have a graph showing the data of the last piece we...
Replies
1
Views
2,449
Hello Folks! I have an issue and its very often but in this case i applied all the tricks and tips that i always do in similiar issues but in this...
Replies
2
Views
776
Hi all - Considering using S7 GRAPH for some sequencing. I have a few questions which I am having difficulty finding clear answers to in the...
Replies
0
Views
577
Back
Top Bottom