For the PID challenged.

Excellent! Thanks Peter. I will try and play with it this week and compare it to the PID and simple on/off controls I have been working with.
 
I've looked over (but not studied or tested) the two programs. I think it is interesting that the simulation protion of the program was longer than the actual control!

Have any of you guys tried this on an actual "hot rod" instead of just a simulator?

The next step, of course, would be to modify the system for "heat/cool" operation. This would have a lot more application, since then it could be used for pressure or flow control in addition to simple heating.

Very impressive work, guys.
 
I was wondering if anyone has even tried the simulator.

There have been quite a few downloads according to our webmaster, but few comments.

Ron's graphs from above are from his hot rod system although I don't consider the results very good. I think this is because I used his data which says there is a deadtime and two time constants. I think there is really only two time constants and no dead time and the dead time is really part of the sensor time constant. This would make the sensor time constant 59 + 17 seconds long or 76 seconds.

Ron, I know that you can save away the data in the graph as a .dbf file. I can take this data and analyze it to find the true time constants and gains. I use a least squares system identification technique.

Tom, I don't know which of the two programs you are looking at, (AD or AB ) but the simulator could be made simpler and smaller if I was interested in the actual temperature and only wanted to calculate the measured temperature. However, part of the point of all this is to show that most people get wrapped up in controlling what they are measuring with out thinking about what really is happening to the actual variables. I sure you have seen equations that look like this

x' = A*x + B*u
y = C*x

In my simulation the actual temperature is x. The input is u. the measured temperature is y.

A are the constant(s) that determine how the actual temperature will decay toward 0.

C are the constant(s) that determine any delay, lag or scaling between the actual temperature and the measured temperature.

I bet SMC this would work well for a refrigeration controller. The on/off valve would control the freon flow. There is still a matter of the compressor pumps. I havn't thought about this much.

One more word of warning. I do have simulation using SMC for motion control of a second order system with a gain, natural frequency and damping factor. This is just a little more complex. The optimum formula for calculating s ( the sliding mode variable ) looks like:

s = e" +c1*e'+c0*e where e = target position - actual position.

The point is that an extra mulitply and add is required and that each system may/will have a different way of computing s.

Controlling flow would be much different. A simple bang-bang valve would chatter and if the fluid was water or oil it would hammer.

Icky812, did you at least try the simulator?
 
Yes I have. So far my testing has been limited (too many phone calls to deal with.) It performs about as well or perhaps marginally better than a PID loop with Time Proportioning control as far as I have been able to tell. I need a better test bed than the current light bulb and thermocouple setup I am using. (The cool off time is too steep.) As soon as I get a chance to put together a better setup I will post some results. I have the components, but not the time currently. :(
 
Did you recalculate the coefficients for your system?

The key to making the SMC work in a optimal way is to know or calcuate the sensor time constant. The sensor time constant must be used to calculate the coefficients. In the Automation Direct program I did not include a routine to calcuate these coefficient but I did document how to calculate them.

There have been over 200 people that have download the original .htm file. Still there are few questions.

I am surprised that no one has asked about 'how does one find the sensor time constant'?

Icky812, unless you recalcuated the coefficients then the fact that the SMC did as well as the PID was shear luck. You must know approximately what the sensor time constant is for your system,
 
... more from the Hotrod ...

Greetings, Peter and all,

I’m still on vacation but I stopped by to read my e-mails, etc. I should be back on Tuesday and have more time to work on this project.

Quote from Peter:
Ron, I know that you can save away the data in the graph as a .dbf file. I can take this data and analyze it to find the true time constants and gains.

I’m not sure exactly WHICH data you’re requesting but here’s what I think you want. Let me know if you need more ... but it will be at least Tuesday before I’ll be able to accommodate you.

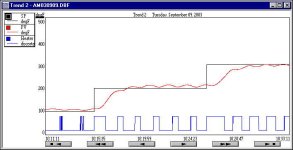
Basically I just ran the Hotrod through the same type of “stepped changes to setpoint” test as in my previous post ... but this time I used RSTrend to capture the data from F8:0 (the SP - setpoint) and F8:1 (the PV - process variable) ... each of these is scaled from 0 to 500 degrees Fahrenheit. I used a data collection update time of 1 second ... and ran the collection for about 23 minutes ... the graph itself is 22 minutes long ... as in the last graph I posted, the air flow (system load) was kept at a constant 20%. I did NOT change any of the settings (sensor time constant, etc.) that you mentioned. I was afraid that any such changes might muddy the waters. Since we’re still using the same settings in this test as in the last one, you should be able to more easily compare apples to apples. I’ll be glad to tinker with the settings that you suggested (or any more up-to-date ones that you’re able to come up with) when I get back on Tuesday.

[attachment]

This is the graph of the test results. I’ll attach the actual data in the next post.

smcdbfa.jpg
 
... and the data ...

Hope this helps. See you Tuesday.

PS edit: I'm SURE that Peter already knows this, but for those of you who may not ... once this .DBF file has been unzipped, you can open it with Excel to view the data ...
 
Last edited:
Let me be the first to ask..

Hi Peter,

I have been following this post for a while. I have to admit, I'm very interested in trying out the SMC. I have downloaded the slc file, but am having trouble opening it. I think it is because you must have developed it on a newer version of RSlogix500 than I am running. I dont know our version number right now, I'm not at work.I have just ordered the newest version last week, and when I get a chance, I will try it out. As per you comment about no one asking "how" you come up with the sensors time constant, let me be the first ask, and to see I my understanding is correct. Please correct me if im wrong, but to come up with the time constant, dont you have to figure out the sensors transfer function? Basically wouldnt you do a "step" response on just the sensor? (i.e - for a thermocouple, apply heat and measure the mV output??) This would give you the sensors, gain, dead time, and time constants. This could be done on a chart recorder..Am I correct?

Thanks,

Andrew Evenson.
 
I need the On/Off status

Excel opens the .dbf file and displays the date, time, SP and PV. However I need the CV and PV. I can then get this data into Mathcad which is a free form spread sheed for engineers. I use Mathcad to make the .htm files and .pgn file on our website that I post the links to.

Given the CV and PV it is easy to compute a formula that can be use to estimate the PV as a function of CV.

I just want to point out that even with PIDs there is no need to guess. Everyting can be calcalated or at least estimated. However, I realize that trial and error is often more realistic which is why SMC should be considered. A SMC heater system only requires that one time constant be estimated or guessed.

Andrew, I am using RSLogix 6.0. We stay updated because we develope and test products. That is good for Rockwell ($), but bad for backwards compatibility. Why isn't there a option to export the program in RSLogix 5.5 or 5.0 format? Many programs have the ability to export in older formats.

Is there a way where RSLogix500 porgrams can be exported in a text format? If there is then I haven't found it. Rockwell got it right with RSLogix5000.

Ron, or any other RSLogix user. Is there a way to plot digital data on the trend. I see where there is an option to do so but I couldn't get it to work. To plot the CV, I would need to take the CV's on/off status and convert it to an analog 0 to 100%.
 
Peter, you said "Icky812, unless you recalcuated the coefficients then the fact that the SMC did as well as the PID was shear luck. You must know approximately what the sensor time constant is for your system,"

This is true to some extent, but one of the things I like about floating control or your SMC control is that, in my experience anyway, it is inherrently less sensitive to exact tuning than a PID loop. Performance is certainly improved with tuning, but it will usually track setpoint better with inexact tuning than a PID loop, and is less prone to hunting.
 
Sorry for the misunderstanding. So far my testing was with the included PV generator. I meant to say that my current test setup for Time Proportioning control would not be adequate to give SMC a fair chance. To be honest it Doesn't even work well with Time Proportioning, ergo the need to change it to something better.

I did get the chance to work on it some Friday evening, but it still is not up to par. I also did notice that you needed to calculate the other values, but I can't do that until I get the new test rig. :rolleyes:
 
I have had code posted for a week now.

There is code for the AD DL250 and a SLC5/04.
See the links above.

I will do some simulations where the estimate of the sensor time constant is a factor of 5 low and a factor of 5 high. I will post this htm file later.

Right now I have work to do. I am still doing battle with the Step7 stuff. What a pain. When I get done cursing at this I may do a step7 FB. It depends on whether I feel like touching this Step7 stuff again. Time stamps. Yuk. We aren't in the dark ages. Everyone else has fiqured out a way do automatically generating a make file.

Icky812, you are right about the time proportioning. If you need finer time increments then you must run the program at a faster update rate. Remember to recaluate the coefficients because they work only for one second updates.

A SMC system for a servo motor may update as faster as 5 to 10 thousand times a second.

The beauty of SMC is the simplicity. On, Off is simple. However there are some versions that can provide a analog output to do this one must use the value of s from the equations s = tau*e' + e and wrap another function around it to generate an analog value. My favorite is the tanh function and it would be used as follows:

10*tanh(K*(tau*e'+e))

Unfortunately most PLCs don't have a hyperbolic tangent function.
However, they should it has a cool property of taking numbers from + to - infinity and converting them to a number between -1 and 1. Now there are two parameters to play with. The time constant tau and the constant K which determines how sharp the curve in the hyperbolic tangent function is. You need to play with the tanh function a bit to understand. The 10 in the equation above scales the + or - 1 to + or - 10. If you need a PWM value then the 10 could be replaced by 32767 or what ever to get + or - 32767. I know, this is too weird.
 
Ever heard of a "Switching Curve"

Hi Peter,


Sorry to bug you, but I've got a quick question...I came acrosss a control scheme in my "Schamum's Feedback and Control" book called "Switching Curve" Control. Is this simular to SMC or is it just deadband control with hysteris?? I dont know if you have ever heard of it before, but thought I'd ask..If my question is unclear, I can post some of the writeup in the book.

Andrew
 
... another graph ... with the heater's output this time ...

Greetings, Peter and all,

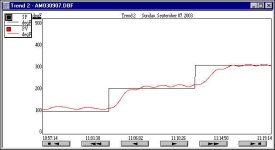
Here is another “stepped changes to setpoint” test from the Hotrod along the same lines as before ... and this time I also captured the heater’s on/off status. To get it to show up on the graph, I used a couple of MOV (Move) instructions to change the value of N7:0 between 20 (while the heater O:4/0 was off) and 80 (while the heater was on) ... then I graphed N7:0 on the trend ... you might have to use Excel, etc. to convert the 20/80 signal into a 0/1 format for your purposes ... but I wanted to show the status on the graph for the folks back home.

I also increased the data collection speed from 1 second to 500 milliseconds to give more resolution.

[attachment]

I’ll attach the data in the next post.

smcdbfb.jpg
 
Last edited:

Similar Topics

Hi, I would like to assemble a simulator/practice booster pump system that uses PID to maintain steady water pressure under various outlet demands...
Replies
0
Views
86
Hello, I have a motor that we are sending a RPM Speed Output from 0-100% to the VFD. However, the Motor HP needs to be limited to 6000 HP and the...
Replies
3
Views
92
I have S7 1512C controler for controlling 48 PID temperature loop, the output is PWM. Please I need the best, most efficient way to write the...
Replies
13
Views
621
Hi all, I'm having trouble solving a problem I've been working on for several months, and thought you might like a stab at it. The machine runs...
Replies
22
Views
966
How can I connect PID Output to a valve. In ladder logic program is there any logic do I want to add between valve and PID? PV=SP What will be the...
Replies
7
Views
423
Back
Top Bottom