PID temperature excel simulator

The default should look like this

The graphical response should be almost perfect. I know and now you know the magic formulas. I should start a new thread for those that want to play along and ask questions.

Oh, one more thing. I made a Scilab directory in my Documents folder. You need to change the current directly to where ever you stored the Scilab file.
The scilab.start file is in the etc directory.
C:\Program Files\scilab-5.2.2\etc

I added this line at the bottom of the scilab.start file just before clear ans.

chdir "c:\Documents and Settings\Peter\My Documents\Scilab\"

Obviously you need to use your user name.

To make the graphs use the export feature and export .png or .jpg files.
The Scilab script can be copied and pasted in between code /code tags

SOPDT.png
 
Last edited:
Hi guys, I hope all has been well. I haven't had a chance to get back on this project for a couple of months. It seems that I've been playing the which project do you want first game.

They gave me the oven for a few hours and this is what I came up with on the trend chart. I know I should have waited a little while longer for a complete steady state, but they needed the oven back.

What do you guys think? I will be trying to come up with some workable numbers with what I have learned so far.

Thanks for all of your help.
 
I will see what my auto tuning software comes up with when I get a chance

It won't take long I just have some other things in the way. It is better it there is some 'soak' time or steady state time. It makes it easier to comput gains. It doens't look like there is much dead time so that is good.
 
Thanks Peter, I'm looking forward to seeing the results. I want to try to compute them myself too, and see if we come up with similar results. This is something that I definitely want to learn how to do.
 
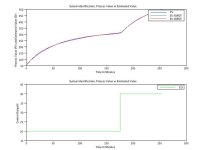
My plant identification of rlawson's system

The data could have been better but I think the results are good. There are three lines. The the actual data or PV, the estimated value for the first order plus dead time ( EV FOPDT ) and the estimated value for the second order plus dead time ( EV SOPDT ). The green EV FOPDT and the red EV SOPDT solutions are very close so they look like the same line with the pixel resolution. The plant gain, time constants and deadtime were similar. There is still something I need to refine before I provide my PID solution. So far the FOPDT solution is just a little bit better.

rlawson.jpg
 
Hi guys. I'm having a hard time finding the process gain. I'm working on it on and off. I wish I could have the oven back for a couple of days to run a better trial.
 
I'm looking at the power output step change from 20% to 40% and the corresponding temperature change climbling. To find the process gain, I know I should start my time at that point. But with the temperature trend not flatlining should I just imply where the temperature should flatline by estimating where I think it will based on the curve? I think if i can figure this out, I will be able to find the process gain and then try and figure out the tuning values. How did you model the trend in scilab so accurately?

Thanks guys.
 

Similar Topics

I have S7 1512C controler for controlling 48 PID temperature loop, the output is PWM. Please I need the best, most efficient way to write the...
Replies
13
Views
623
I have an old Chinese Temperature PID controller XMT 8038c2kp that am able to send and receive requests via Modbus poll test center in this format...
Replies
0
Views
445
I have PID temperature control which will connect to Beckhoff EL4004(0v-10v). How I can program it to let EL4004 to control the temperature?
Replies
7
Views
2,636
Hi everyone, Im planning to replace existing temperature controllers with a PLC. The setup will be aprox 8 thermocuples, and the outputs are 8...
Replies
10
Views
5,384
I'm doing PID temperature controller using PLC. I'm doing a cascaded P, and PI controller of both temperature set points. My question is how...
Replies
6
Views
1,736
Back
Top Bottom