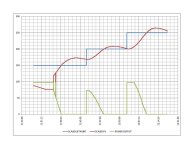
PID temperature excel simulator

Here's a chapter in the PLC manual that deals with their implementation of the PID loop. Pages 6-15 would be the relevant material, I think. Edit: I should note that this information pertains to the PID he will be moving to, not the one he has now.

http://www.automationdirect.com/static/manuals/d2user/ch8.pdf


You are correct. I have read that chapter so many times that I think I have it committed to memory.


Also, keep in mind that a batch furnace wouldn't really have a feed forward in the traditional sense. You would be thinking about belt-type furnace. A batch furnace (to me anyway) would have a load of X pounds placed in it and left there for the entire processing time, then removed. In my case X can range from 10 to 1000 pounds or more in some of our equipment.


Brian

You are correct again. This is exactly my type of process.


We have several different types of batch ovens with a constant load, and annealing ovens that have wire strands running through them. 1 of the batch ovens has a Chromalox PID controller, 1 has a Honeywell, and yet another has a Watlow controller. Even though all of the batch ovens have their similarities, PID parameters vary pretty wildly. I know that the heating and cooling rates, dead time, heating methods are all a little different though.
 
I was posting the link and the furnace description more for Peter's benefit, but it is good that you have seen it too. It helps to make sure everyone is on the same page.

Brian
 
I found this trend chart that I was doing with a preset stepped SP. I wish I would have extended the dwell times.

just in case you've misunderstood, the graph that we need should be done in the MANUAL mode (an "open loop" test) ...

specifically, we don't want to change the Setpoint - we want to make a step change to the "drive" going to the heater (specifically, in Allen-Bradley talk this would be called the CV - the "Control Variable" ) ...

in other words, we're not trying to see how the controller "controls" the system ... instead we're trying to determine the characteristics of the "raw" system itself ... the Setpoint doesn't even belong on the graph we're looking for ...
 
Thanks Ron, I just finished reading about getting the process gain on controlguru. I see exactly what you are looking for now. That takes the PID out of the equation by manually stepping the CO by a certain percentage and waiting for the PV to stabilize again and measuring the CO delta and the PV delta. But for example say my max range for the oven is 500 degrees, should I shoot for around 50% of max (250 deg/f) for a starting point? In other words, start out by setting the CO to around 20 percent or whatever percentage it would take to get the PV to around 250 and let it stabilize? Or would that matter what the PV happen to stabilize at? I guess what I am asking is depending on what range of the max scale I let the PV stabilize, wouldn't the process gain be different or is that enough to make a difference?
 
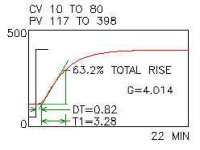
this is an overview of what I personally need to see – but keep in mind that Peter's methods might certainly be different ...

choose an output setting that will provide an "initial temperature" (PV1) which is somewhat above ambient – but the lower the better ... a "cold start" will NOT be suitable ... in other words, you need "some heat" – but not much – and the temperature MUST settle down to a "steady state" or "flat line" condition before you make the step change to the controller's output ...

the "final temperature" PV2 needs to be somewhat below maximum – and a somewhat larger change ("total rise") is usually easier to work with than a very small change ... anything "reasonable" is OK - but obviously you don't want to "over-fire" and damage the equipment just to make the test ...

after you've made the step change, the temperature MUST settle down to a "steady state" or "flat line" condition in order to be useful for our purposes ... BUT ... even if the trend graph doesn't fully show the final "steady state" condition, we can USUALLY still work with the test – AS LONG AS you record the final "steady state" temperature and make it available to us ... in simplest terms, we can live without the "bitter end" of the graph – as long as we know for certain what value the final temperature eventually settled down at ...

the figure below might give you some better understanding of what I personally am looking for ... right now my schedule won't allow me enough time to type up a suitable description – but I'll be glad to discuss it with you by phone if you want to give me a call ...


characteristics.JPG
 
I found the auto tune program that I wrote 2 years ago

http://www.deltamotion.com/peter/Scilab/
There is a trick to auto tuning. The excitation must be done properly so the optimizing algorithm can easily find the correct result. Look at the two examples in the autotune directory. One is from the control guru heat exchanger and the other is from Ron Beaufort's hotrod.

The comments in the autotune.sci file tell how to run the program. You can see it go through the iterations as it searches for the best set of plant parameters.

I will try to make a SOPDT temperature simulator this weekend.
 
Thanks guys I really appreciate all of the help. I've learned most of what I know about PID from this forum. I am really enjoying learning in depth about how PID really functions.
 
If you can export the trend to an excel file then to a CSV file you can tune your system. Look at the format for the two .txt files.

I have both excel files for the 2 charts that I have posted already.

Hopefully in the next few days I can get a new trend of manually stepping the CO and waiting for the PV to stabilize.
 
But did you run the auto tune program on the heat Exchange and the HotRod data?

Just to see what it does.

I have both excel files for the 2 charts that I have posted already.
I can tell roughly what your system is like by looking but the text data for the computer is so much better.

Hopefully in the next few days I can get a new trend of manually stepping the CO and waiting for the PV to stabilize.
That would be good.
 
I have a SOPDT simulator at
http://www.deltamotion.com/peter/Scilab/SOPDT/
There are three files now. I will probably break the program up into more smaller files in the future. At this time you need to execute SOPDT.SCE from the Scilab editor or Command window.

The current version tunes itself. You can change the plant gain, time constants, dead time and ambient temperature. There are formulas that will calculate controller gains. You can comment these out and use your own values if you want.
 

Similar Topics

I have S7 1512C controler for controlling 48 PID temperature loop, the output is PWM. Please I need the best, most efficient way to write the...
Replies
13
Views
623
I have an old Chinese Temperature PID controller XMT 8038c2kp that am able to send and receive requests via Modbus poll test center in this format...
Replies
0
Views
445
I have PID temperature control which will connect to Beckhoff EL4004(0v-10v). How I can program it to let EL4004 to control the temperature?
Replies
7
Views
2,636
Hi everyone, Im planning to replace existing temperature controllers with a PLC. The setup will be aprox 8 thermocuples, and the outputs are 8...
Replies
10
Views
5,384
I'm doing PID temperature controller using PLC. I'm doing a cascaded P, and PI controller of both temperature set points. My question is how...
Replies
6
Views
1,736
Back
Top Bottom