MaxK
Member

I filtered the "armature amps on the main motor" curve and scaled the curves #45 graph.
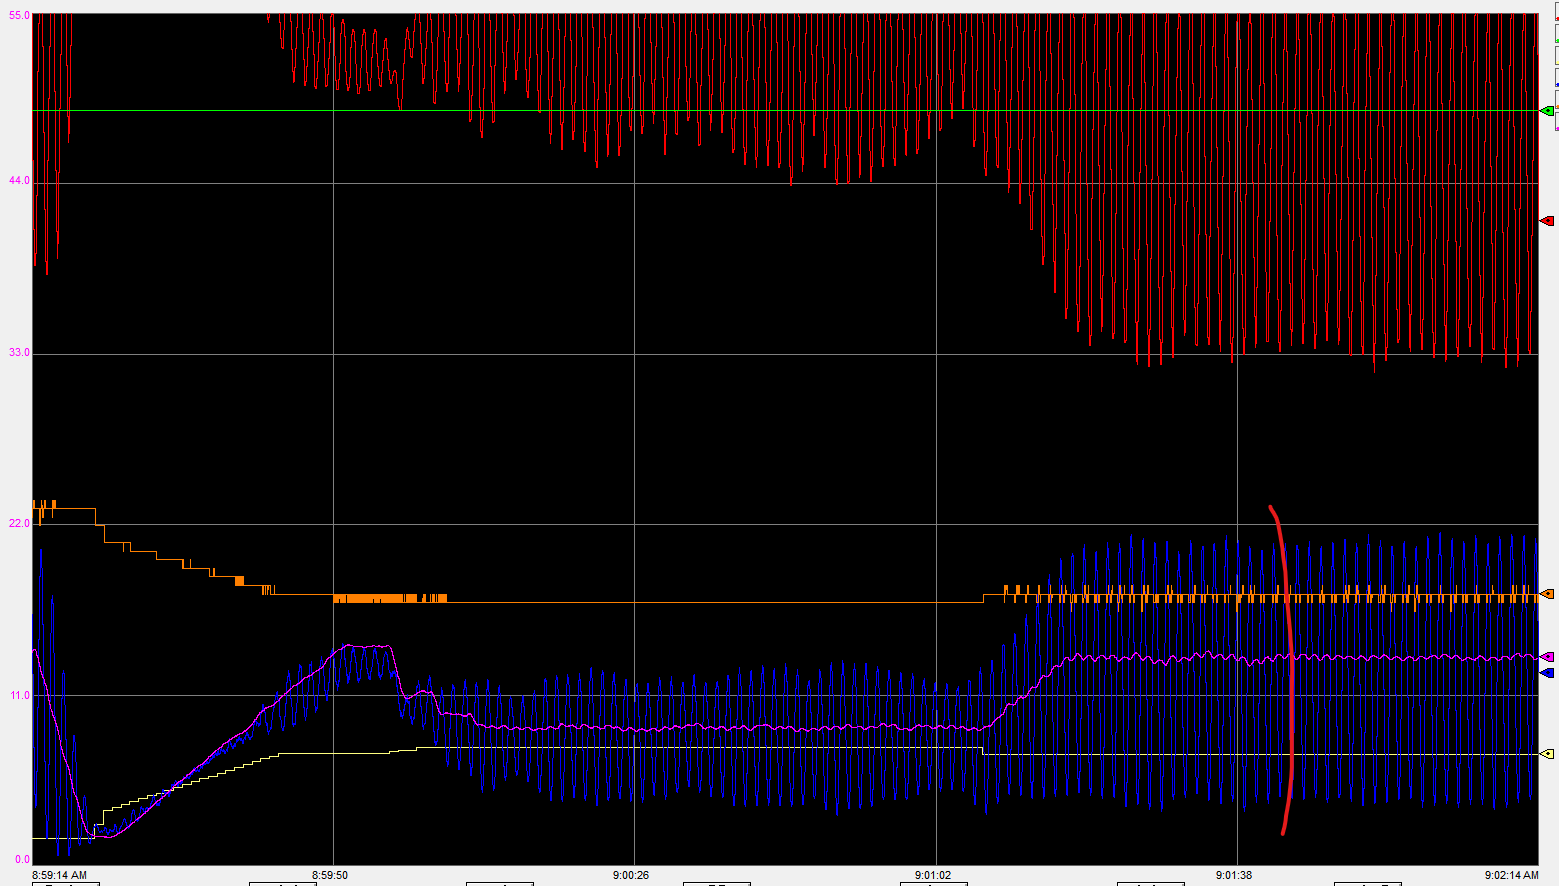
"motor current" orange curve confuses me:
Graph #5 has spikes.
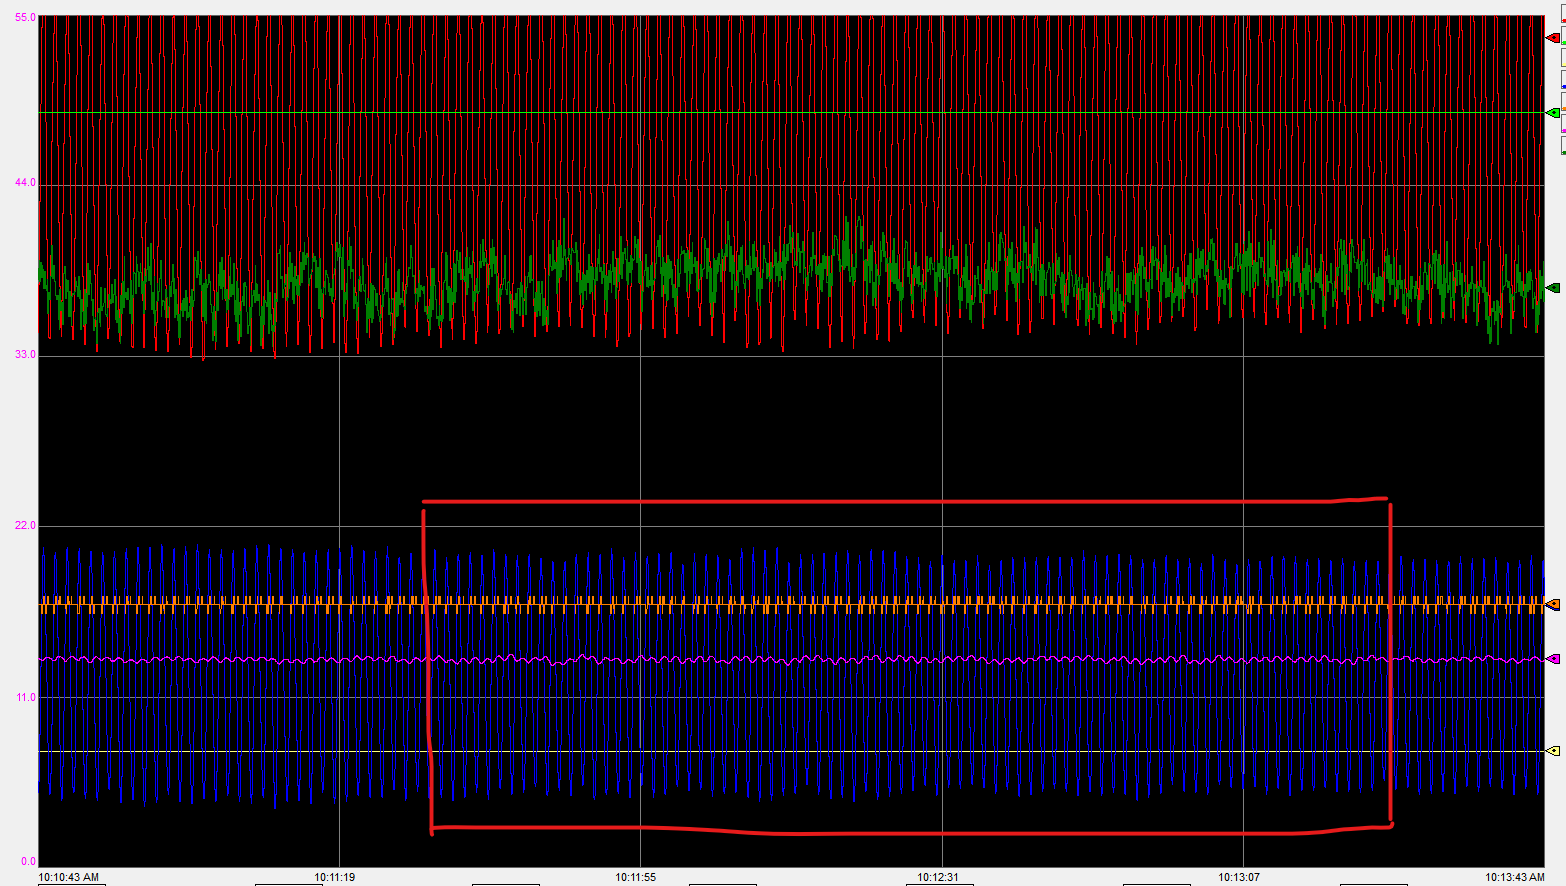
Graph #8 does not show any reaction to the change of other parameters.
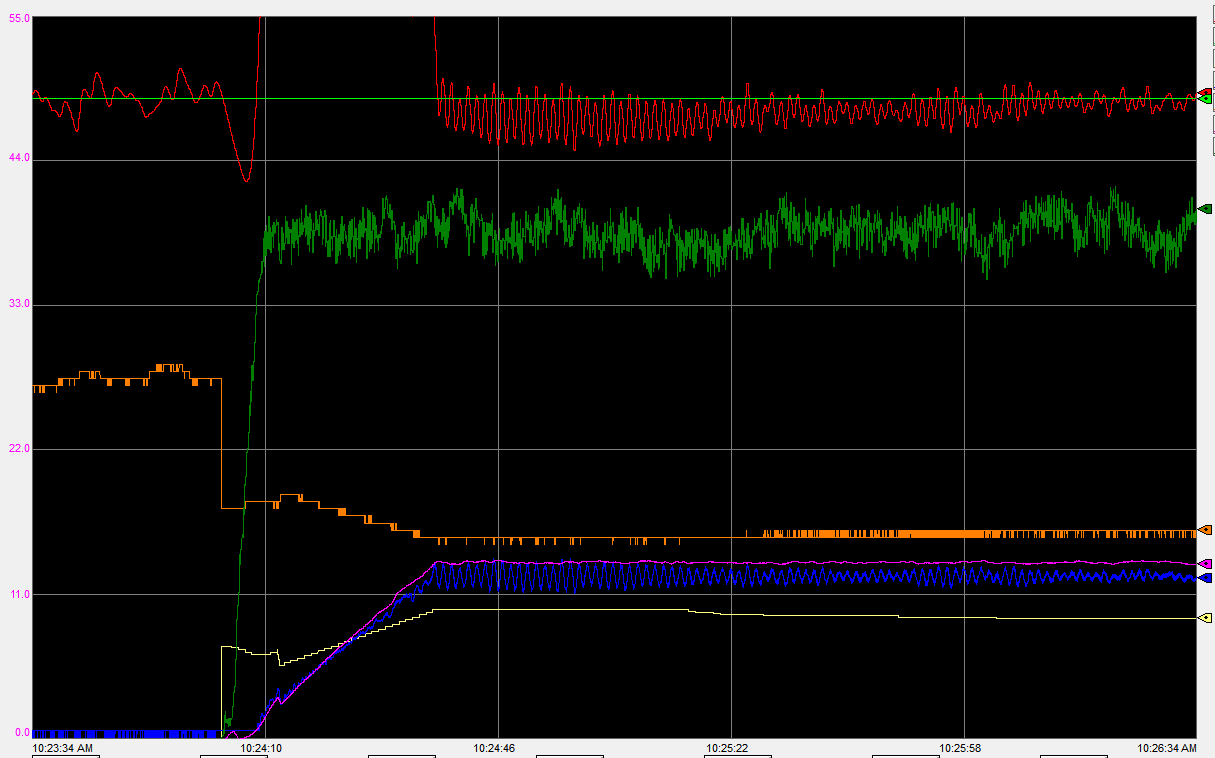
Graph #45 has spikes again.
I don't have the slightest idea how to interpret this curve (dependence on other parameters). Perhaps an increase in resolution will clarify.
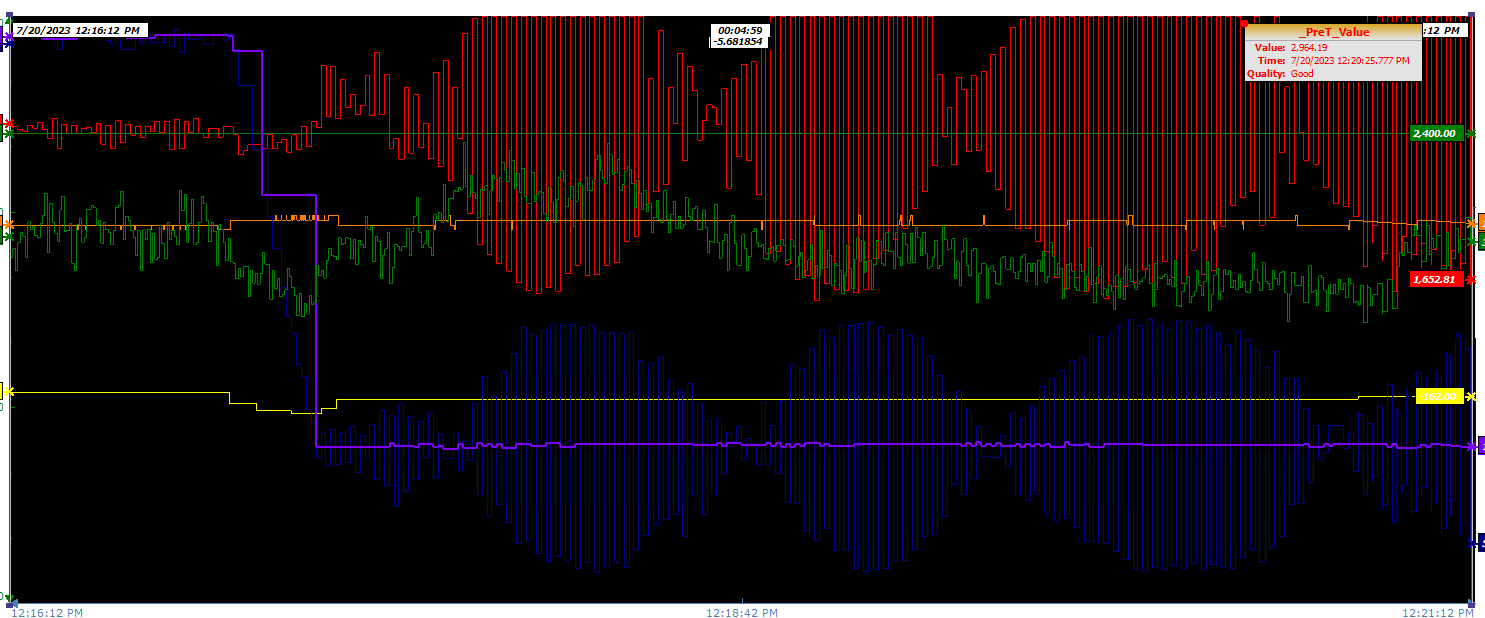
Take a look at "armature amps on the main motor" green curve and “I.Feedback from the main drive” purple curve.
Graph "Oscillation" - the curves are quite pronounced in antiphase.
Graph " Stabilization" - as the antiphase (high frequency) decreases, the system stabilizes.
I am not saying that the main drive is the cause of the oscillations. Actually I don't think at all that there is "the only" source of oscillation - I consider that interaction of few elements of the system generates resonance.
I would suggest changing the main drive (speed control drive) PID settings, for example reduce the gain (Kc) a little bit and see if the system behavior changes.


"motor current" orange curve confuses me:
Graph #5 has spikes.
Graph #8 does not show any reaction to the change of other parameters.
Graph #45 has spikes again.
I don't have the slightest idea how to interpret this curve (dependence on other parameters). Perhaps an increase in resolution will clarify.
Take a look at "armature amps on the main motor" green curve and “I.Feedback from the main drive” purple curve.
Graph "Oscillation" - the curves are quite pronounced in antiphase.
Graph " Stabilization" - as the antiphase (high frequency) decreases, the system stabilizes.
I am not saying that the main drive is the cause of the oscillations. Actually I don't think at all that there is "the only" source of oscillation - I consider that interaction of few elements of the system generates resonance.
I would suggest changing the main drive (speed control drive) PID settings, for example reduce the gain (Kc) a little bit and see if the system behavior changes.