You are using an out of date browser. It may not display this or other websites correctly.
You should upgrade or use an alternative browser.
You should upgrade or use an alternative browser.
Thermocouple not steady values
- Thread starter KonstantinKolev
- Start date
drbitboy
Lifetime Supporting Member
Thank you very much for that; I have a few more questions:Hi,
I appreciate all of the opinions above.
Let me give a bit more light about what the application is. ...
Post #1 says there are spikes in the measured temperature (PID_Delta_Seal_n.PV?), but in the plots we only see spikes in the CVEU of the PID. I assume this is because the "weird behavior disappeared, for an unknown reason; is that correct?
What is the configured loop update time of the PIDE?
How does the program ensure the PIDE actually executes at the configured loop update time i.e. what is the actual loop update time?
What is the configured cycle time of the SRTP instruction?
Would it be possible to post all the configuration data for the SRTP and PIDE instructions?
Do you have any idea why there are spikes in the trends of the PIDE CVEU values?
Last edited:
drbitboy
Lifetime Supporting Member
More questions:
What are the sample times of the trends attached to post #14?
Is there any derivative action (non-zero value for KD or TD) configured in the PIDEs?
Is there any filtering configured on the derivative action in the PIDEs?
What are the sample times of the trends attached to post #14?
Is there any derivative action (non-zero value for KD or TD) configured in the PIDEs?
Is there any filtering configured on the derivative action in the PIDEs?
To overshoot that much and then to suddenly "fix" itself, soundsl like an immersion heater. The TC is near or on the heating element and it superheats quickly when there is no product being heated...ie, no heat sink, just air. Once product is introduced, you're under control, as now you have a hink sink, dampening the heater response. Just a guess, and could not be applicable here, but I see this all the time in my industry.
KonstantinKolev
Member
OP
Hi,
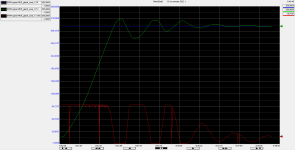
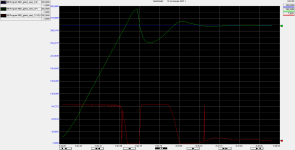
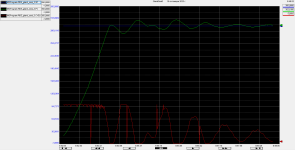
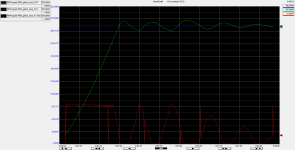
I apologize for the misleading pictures in post #14. If actually look at the variable that are monitored, on the first 3 pictures the variables monitored are from another module of the machine called delta seal. Only the the 4th picture - Gland Seal 4 is monitoring the heaters on the gland seal module.
The gains of the PIDE are as follow:
P = 20.0
I = 100.0
D = 0.5
The PIDE gains are taken from previous projects where they worked well.
The heater is basically in a coil heater and there is a metal housing around it.
As the mentioned topic on post #16 about the grounded and ungrounded thermocouples. As you can see in the heater pictures in the pdf file, there is a yellow-green wire that is part of the thermocouple wires but since we were not sure if we need to connect it or not, it is not connect at the moment. I remember that we tried to connect it to ground which is connected to the neutral but I did not remember to get any advantage of it.
Attached you can find the trends for the Gland Seal heaters with the right variables monitored.
The pdf file shows the heaters themselves and the wires as well as the parameters for the SRTP function block.
Due to the size of the pdf you can have access to the file via the link
Best Regards
Konstantin Kolev


I apologize for the misleading pictures in post #14. If actually look at the variable that are monitored, on the first 3 pictures the variables monitored are from another module of the machine called delta seal. Only the the 4th picture - Gland Seal 4 is monitoring the heaters on the gland seal module.
Thank you very much for that; I have a few more questions:
Post #1 says there are spikes in the measured temperature (PID_Delta_Seal_n.PV?), but in the plots we only see spikes in the CVEU of the PID. I assume this is because the "weird behavior disappeared, for an unknown reason; is that correct?
That is the point, as I mentioned before the weird behavior of the thermocouple disappeared in the last few heating procedures.
What is the configured loop update time of the PIDE?
The PID routine loop time is 10 ms.
How does the program ensure the PIDE actually executes at the configured loop update time i.e. what is the actual loop update time?
The PID routine is in a separate cyclic task.
What is the configured cycle time of the SRTP instruction?
The cyclic time of the SRTP instruction is the same as cyclic time of the PID loop - 10 ms. It can bee seen in the SRTP parameters in the pdf file.
Would it be possible to post all the configuration data for the SRTP and PIDE instructions?
The pdf file contains the SRTP parameters but the PIDE paramaters are so many for I have
Do you have any idea why there are spikes in the trends of the PIDE CVEU values?
No idea why this is happening, perhaps it sees a very high temperature and adjusts the control output accordingly which happens in a very short period of time.
More questions:
What are the sample times of the trends attached to post #14?
Each sample is 1 s.
Is there any derivative action (non-zero value for KD or TD) configured in the PIDEs?
There is a derivative gain of 0.5. You can check the pdf file for more parameters.
Is there any filtering configured on the derivative action in the PIDEs?
I do not really know which parameters is responsible for this filtering therefore probable there is not.
The gains of the PIDE are as follow:
P = 20.0
I = 100.0
D = 0.5
The PIDE gains are taken from previous projects where they worked well.
The heater is basically in a coil heater and there is a metal housing around it.
As the mentioned topic on post #16 about the grounded and ungrounded thermocouples. As you can see in the heater pictures in the pdf file, there is a yellow-green wire that is part of the thermocouple wires but since we were not sure if we need to connect it or not, it is not connect at the moment. I remember that we tried to connect it to ground which is connected to the neutral but I did not remember to get any advantage of it.
Attached you can find the trends for the Gland Seal heaters with the right variables monitored.
The pdf file shows the heaters themselves and the wires as well as the parameters for the SRTP function block.
Due to the size of the pdf you can have access to the file via the link
Best Regards
Konstantin Kolev


Last edited:
This is not an issue of noise.
Just looking at the latest trends, one can see that the step response is barely stable. Too much overshoot and ringing.
I repeat:
Just looking at the latest trends, one can see that the step response is barely stable. Too much overshoot and ringing.
And what are WE supposed to do with this information ?The gains of the PIDE are as follow:
P = 20.0
I = 100.0
D = 0.5
Do these projects have the same step response ? If not, what is the difference ?The PIDE gains are taken from previous projects where they worked well.
I repeat:
Looks to me as if the PID gains are simply too high.
Last edited:
drbitboy
Lifetime Supporting Member
Actually 10ms (0.01s) is its execution time; the PWM/TP Cycle Time (from the PDF file, first page, second row: "Cycle Time") is 10s, or a thousand times the execution time, which is also a thousand times the PID loop update time.What is the configured cycle time of the SRTP instruction?
The cyclic time of the SRTP instruction is the same as cyclic time of the PID loop - 10 ms. It can bee seen in the SRTP parameters in the pdf file.
Also, I notice that the MaxHeatTime is 1000.0, which is invalid, and causes a fault (rows InstructFault and MaxHeatTimeInv[alid]); what that fault means in SRTP operation is TBD.
This process moves slowly enough that that the PID Loop Update Time (LUT) of 10ms is pretty aggressive, and intuitively it makes sense that it be more in line with the SRTP cycle time or vice versa; whether to increase the PID LUT, or decrease the SRTP Cycle Time, or both, is another discussion. That said, assuming the temperature updates are happening quickly enough, the PID algorithm is usually fairly robust so the timings may not matter.
The fact that the CV is spiking in the trends suggests to me the possibility that there are still spikes in the analog input from the thermocouple, but with a trend sampling time of 1s we do not see them in the trend; that is only a possibility though - if we see spikes in the CV then it seems statistically unlikely that we would not see spikes in the PV, which PV spikes presumably cause the CV spikes?
So the original question - why are there spikes in the thermocouple/PV readings - is still a mystery, but several electrical explanations have been suggested. I think it's likely that the spikes are not real, unless the thermocouple bead is in direct contact with the heating element, and even then they would not be "real" in the sense of being representative of the bulk temperature of the device being controlled.
Tuning is a separate issue; the temperature swings attenuate over several minutes, which may be acceptable as-is if a single run lasts a few hours or more, but it certainly could be better. The second thing I would do, after reducing gains as suggested by @JesperMP, is assign a value of 0.0 to the KD gain, because those CV spikes may be indicative of derivative action. I'm not saying this process does not need derivative action, but removing it will provide an idea of the relative magnitudes of the relative responses of KD vs. KP; the 10ms (0.01s) LUT is in the denominator of the derivative term, so that 0.5 KD may actually be more like 50 when comparing apples and apples wrt the proportional action (assuming the time units are seconds; if minutes then it would be 3000).
But better than that empirical/random approach would be characterizing the system with a manual step change in CV output, estimating deadtime and lag of the PV response, and basing the tuning parameters on that e.g. an analytical model (differential equations or Laplace transforms) if that is in your toolbox, or something like the Cohen-Coon approach.
Last edited:
My theory is that these spikes in the trend are actually caused by the trended variable not being the real control tag but some other tag. Or the trend updates asyncronously with the program scan, and the trend is updating when the program is writing a temporary value to the tag. No matter, I agree that the spikes aren't relevant.The fact that the CV is spiking in the trends suggests to me the possibility that there are still spikes in the analog input from the thermocouple, but with a trend sampling time of 1s we do not see them in the trend; that is only a possibility though - if we see spikes in the CV then it seems statistically unlikely that we would not see spikes in the PV, which PV spikes presumably cause the CV spikes?
The second thing I would do, after reducing gains as suggested by @JesperMP, is assign a value of 0.0 to the KD gain, because those CV spikes may be indicative of derivative action.
edit: Yikes. That was a brainfart. It is the other way around. the D part is NOT applied to the setpoint. Ignore what I wrote.
Last edited:
drbitboy
Lifetime Supporting Member
[update: @JesperMP corrected the typo]But I agree, set it to 0.
The PIDE PVEDerivative parameter is 1 (see bottom of page 5 of PDF), so D action should respond only to PV rate-of-change, and ignore setpoint changes.
DSmoothing, the next PIDE parameter below that, could be set to 1 to attenuate the CV output spikes, assuming KD gain is not assigned a value of 0.
But I agree with @JesperMP: the spikes are not the real problem.
Last edited:
MaxK
Member
I don't understand how thermocouples relate to the red curves.
I doubt that the CV spikes are related to the D-term (PIDE instructions "features"?)
I think it makes sense to slightly reduce the common PID gain
OT:
Is the process is to maintain a given temperature of the environment in which the part is heated?
Can anyone write down the transfer function of plant?
drbitboy
Lifetime Supporting Member
The units of KD = 0.5 are minutes (cf. here and here), and the loop update time is 10ms, so 60KD is 3000, so the derivative term applies ~150 times more gain than the proportional term (KP = 20) to PV spikes, if present. Those red spikes are coming from somewhere, the PID equation is fairly simple, and SP is constant. So it's hard to believe they are coming from anywhere other than the PV's dynamic behavior passed through the filter of the PID algoritm. Whether that PV behavior is visible in a 1Hz trend is another matter.I doubt that the CV spikes are related to the D-term (PIDE instructions "features"?)
The PIDE is set to use the Independent Gains form of the PID equations (cf. here and here [DependIndepend] and page 5, eighth row from the bottom here), so there is no common gain.I think it makes sense to slightly reduce the common PID gain
MaxK
Member
Gosh, why did you attack me?... the derivative term applies ~150 times more gain than the proportional term ...
1. Huge D-term. #17 Gland seal 2.png 8:44:34(?) very noticeable slope of the temperature curve. Why doesn't the PID respond until 8:44:37? Where is Huge D-term?
2. Sampling time. Yes, it is theoretically possible that the signal from the thermocouple spikes during the PID sample. A neat, clear single 10 ms electrical pulse in the thermocouple circuit, D-term amplified it, we saw it on the chart.
a) a spike in the thermocouple signal, the result of an electrical phenomenon (interference, breakdown), the result of which is not a neat 10 ms pulse, but much more interesting and smeared curves.
b) if we sum it up, there are approximately 2 dozen PID spikes on all charts and not a single notch on the temperature curve
3. Let's turn to Captain Obvious?The PIDE is set to use the Independent Gains form of the PID equations
What are we all doing here?
If you want to catch an impulse, add a counter-catcher to the program
If abs(measured value – filtered value (previously measured value) ) > delta
Then pulse_counter := pulse_counter + 1
If you want to neutralize the effect of the impulse, add to the program
If abs(measured value – filtered value) < delta
Then filtered value := measured value
Else filtered value := filtered value +sign(measured value – filtered value) * delta
delta - physically the maximum permissible change in the measured value during the PID-sample
Everything else with the available volume and accuracy of data is pointless
drbitboy
Lifetime Supporting Member
b) if we sum it up, there are approximately 2 dozen PID spikes on all charts and not a single notch on the temperature curve
Yes, that has already been mentioned. Twice. PV spikes were visible at one point, at least to OP (cf. Post #1). I already stated that, statistically, not seeing PV spikes on the trend is an anomaly. Investigating that anomaly, and determining if it is related to the problem at hand, is OP's problem.
In the meantime I am going with the data we have, and the PIDE algorithm is simply not that complicated. What else could be causing the CV spikes other than changes in PV?
drbitboy
Lifetime Supporting Member
1. Huge D-term. #17 Gland seal 2.png 8:44:34(?) very noticeable slope of the temperature curve. Why doesn't the PID respond until 8:44:37? Where is Huge D-term?
"very noticeable slope" is actually gentle and insignificant compared to a large step change of PV over 10ms (if that is even what it happening).
"Where is Huge D-term?" Over the noticeable but gentle slope It is attenuated by the small Δt (10ms = 0.000167minutes). Also, it is only the change in slope generates significant movement; a constant, or slowly changing, PV slope will effect minimal changes in CV.
"Why doesn't the PID respond until 8:44:37?" D- and P-terms to increase CV are pitted against per-loop-update-accumulating I-term that is trying to decrease CV, all while CV is saturated low. Only when error is small is per-update I-term smaller than D- and P-terms, which allows CV to move off of the saturated limit.
drbitboy
Lifetime Supporting Member
Gosh, why did you attack me?
I did not attack you (but you did not feel attacked; you just forgot the smiley, right?); I "attacked" your conclusion (that the CV spikes are not primarily due to Derivative action).
But it's easy to test; all OP has to do is assign 0 as value of KD. If the CV spikes remain, then I am wrong; it the CV spikes disappear or are attenuated, then I am possibly right.
Similar Topics
I am having an issue getting a IY4 to read my thermocouple correctly. We have a R type and K type hooked up and sitting at a known room...
- Replies
- 5
- Views
- 531
Posted by
u/mr_biodtox
44 minutes ago
Delta ISPSoft - Establishing communication with thermocouple module
Hi,
How do I establish communication...
- Replies
- 1
- Views
- 338
Hello. PLC beginner here, so apologies in advance for any incorrect terminology or poor communication.
I have an SLC 500 Thermocouple/mV Analog...
- Replies
- 1
- Views
- 649
Hello Guys,
Trying to scale a thermocouple directly into my IY4 card. Connected into the terminal +\-.
I’ve scaled the range of my J type to...
- Replies
- 4
- Views
- 1,669
Hello I have a project to record temperature from thermocouple and store it to memory card, the problem is my client didn't provide new...
- Replies
- 11
- Views
- 2,950


